# Monitor a Silo Server with Grafana
LLMS index: [llms.txt](/llms.txt)
---
[Grafana](https://grafana.com/) allows you to query, visualize, alert on and understand your metrics no matter where they are stored.
## Prerequisites {#prerequisites}
- An existing [Prometheus deployment](https://prometheus.io/docs/prometheus/latest/installation/) with backing [Alert Manager](https://prometheus.io/docs/alerting/latest/overview/)
- An existing MinIO deployment with network access to the Prometheus deployment
- [Grafana installed](https://grafana.com/grafana/download)
> [!NOTE]
> **Grafana dashboards use metrics version 2**
>
> The MinIO Grafana dashboards use [metrics version 2](/operations/monitoring/metrics-v2/#minio-metrics-v2). For more about metrics API versions, see [Metrics and alerts.](/operations/monitoring/metrics-and-alerts/#minio-metrics-and-alerts)
>
> Version 3 metrics require creating your own dashboard. For more information about dashboards, see [the Grafana documentation.](https://grafana.com/docs/grafana/latest/dashboards/)
## MinIO Grafana Dashboard {#minio-grafana-dashboard}
MinIO provides several official Grafana Dashboards you can download from the Grafana Dashboard portal.
1. [MinIO Server metrics](#minio-server-grafana-metrics)
2. [MinIO Bucket metrics](#minio-buckets-grafana-metrics)
3. [MinIO Replication metrics](#minio-replication-grafana-metrics)
To track changes to the Grafana dashboard, inspect the JSON files for the [server](https://github.com/minio/minio/blob/master/docs/metrics/prometheus/grafana/minio-dashboard.json) or [bucket](https://github.com/minio/minio/blob/master/docs/metrics/prometheus/grafana/bucket/minio-bucket.json) dashboards in the MinIO Server GitHub repository.
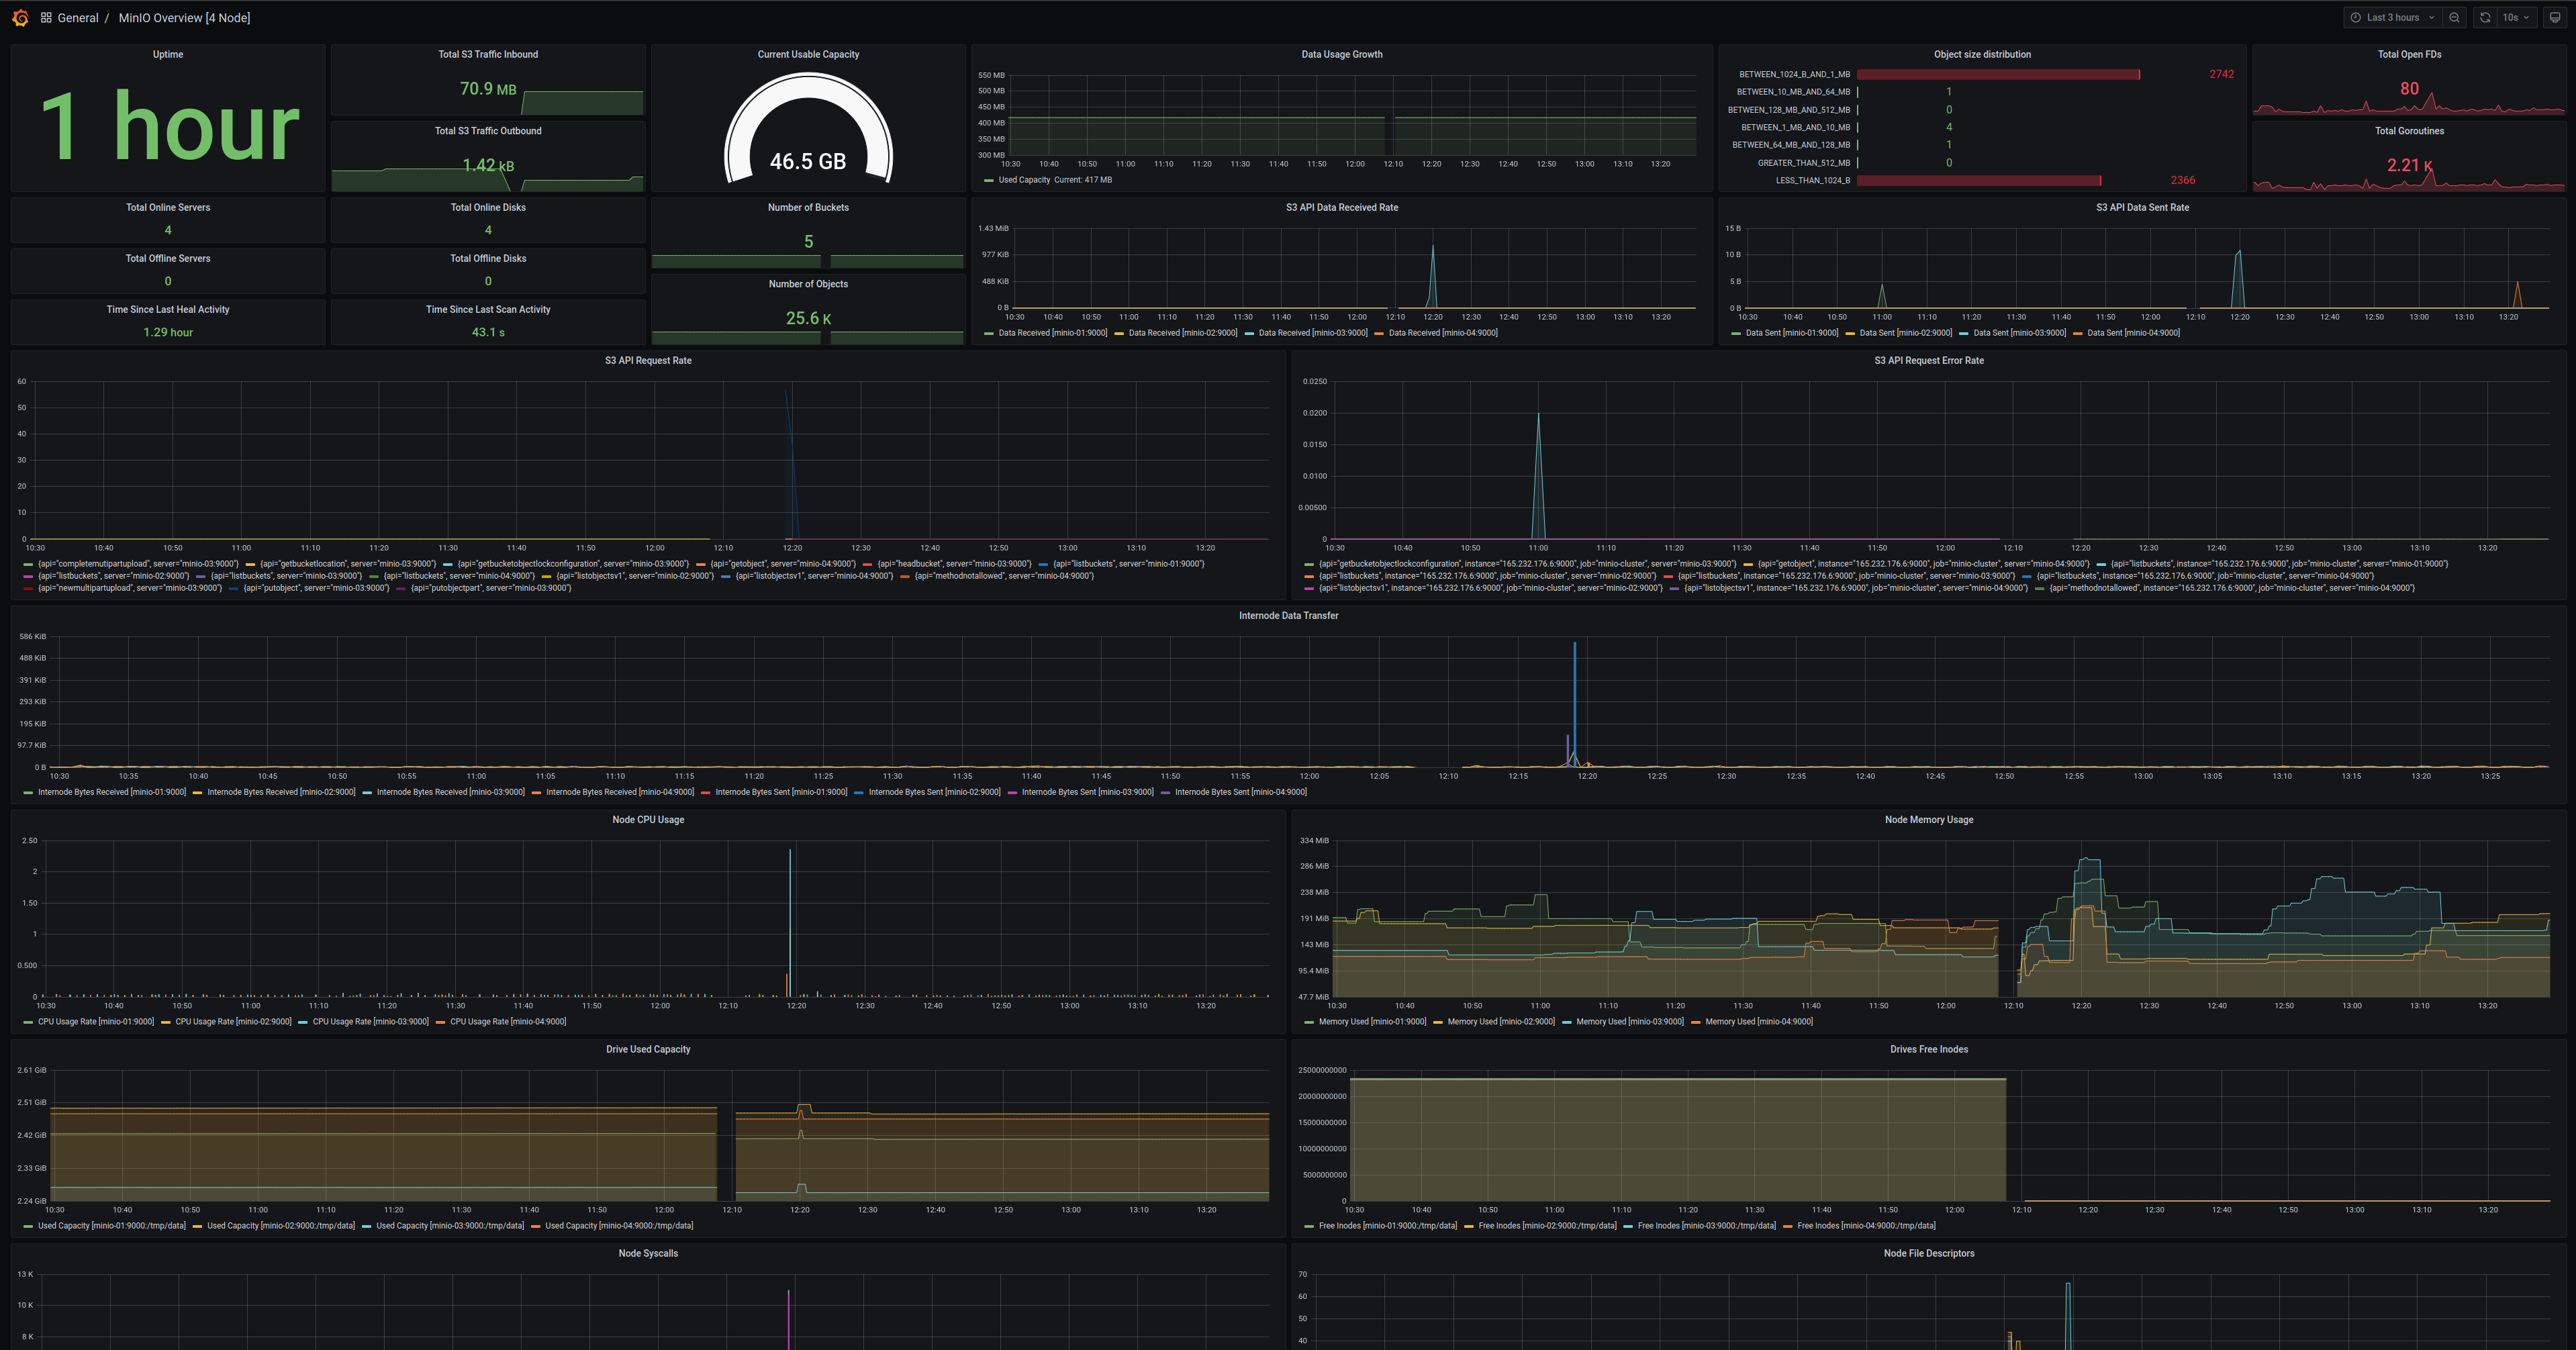
### MinIO Server Metrics Dashboard {#minio-server-metrics-dashboard}
Browse the maintained MinIO dashboards in the [MinIO organization catalog on Grafana](https://grafana.com/orgs/minioinc/dashboards), then select a server dashboard compatible with the metrics version exposed by your deployment.
MinIO provides a Grafana Dashboard for MinIO Server metrics. For specifics on the dashboard’s configuration, see the [JSON file on GitHub](https://raw.githubusercontent.com/minio/minio/master/docs/metrics/prometheus/grafana/minio-dashboard.json).
For MinIO Deployments running with [Server-Side Encryption](/operations/server-side-encryption/#minio-sse-data-encryption) (SSE-KMS or SSE-S3), the dashboard includes metrics for the KMS. These metrics include status, request error rates, and request success rates.
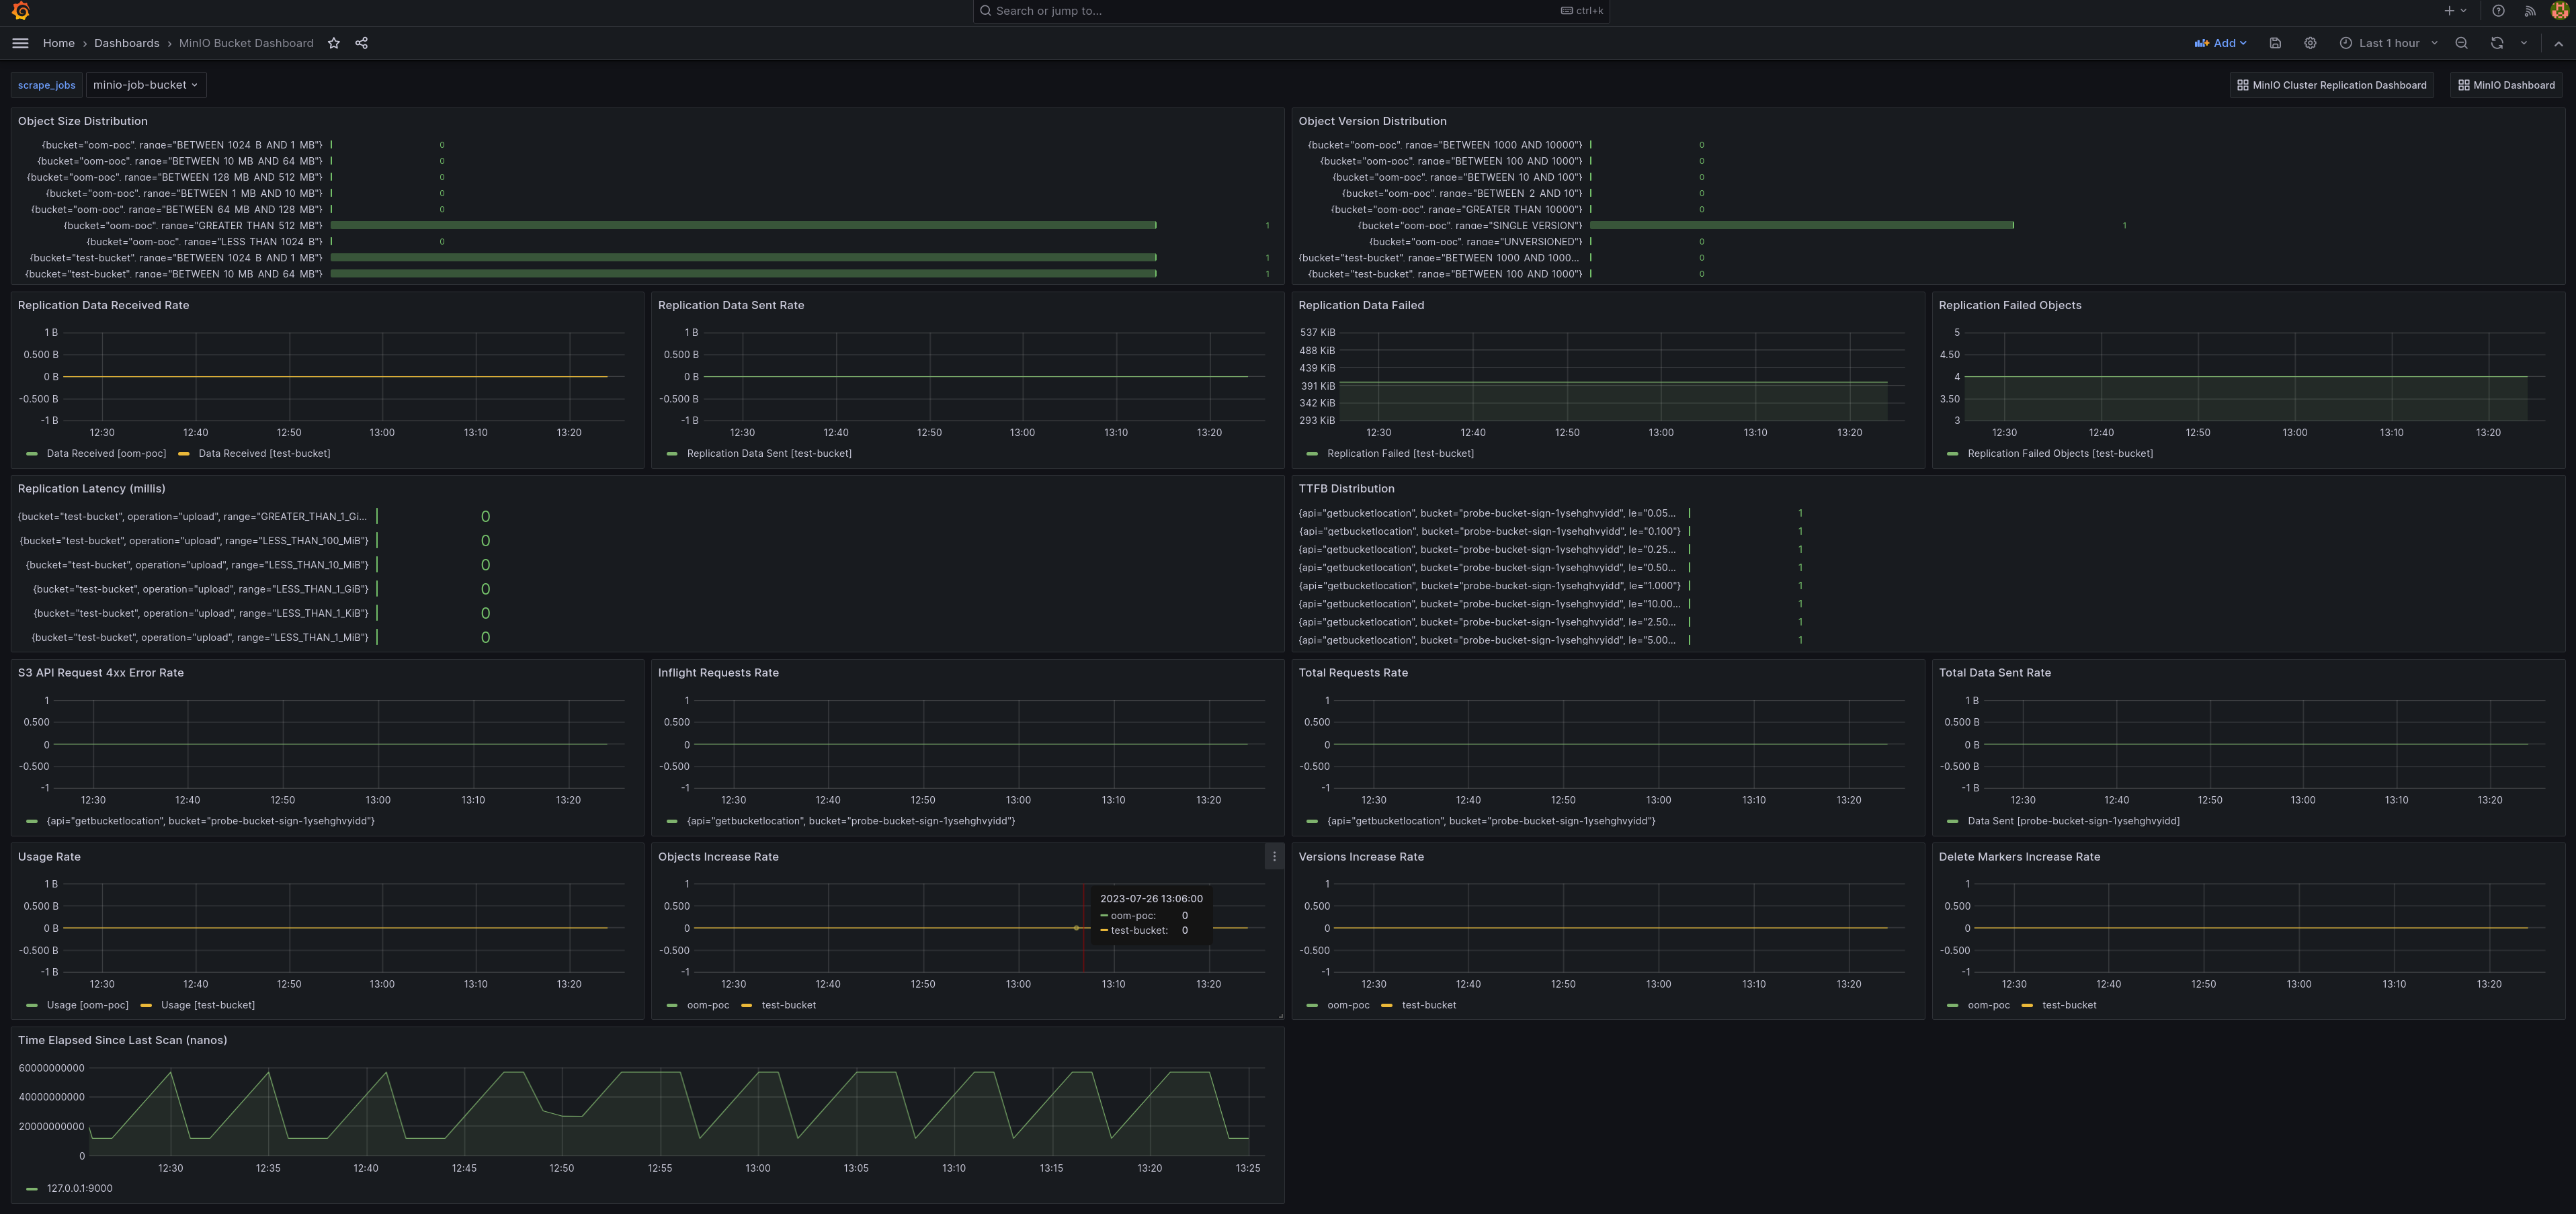
 ### MinIO Bucket Metrics Dashboard {#minio-bucket-metrics-dashboard}
Use the [MinIO organization catalog on Grafana](https://grafana.com/orgs/minioinc/dashboards) to select a bucket dashboard compatible with the metrics version exposed by your deployment.
Bucket metrics can be viewed in the Grafana dashboard using the [bucket JSON file on GitHub](https://raw.githubusercontent.com/minio/minio/master/docs/metrics/prometheus/grafana/bucket/minio-bucket.json).
### MinIO Bucket Metrics Dashboard {#minio-bucket-metrics-dashboard}
Use the [MinIO organization catalog on Grafana](https://grafana.com/orgs/minioinc/dashboards) to select a bucket dashboard compatible with the metrics version exposed by your deployment.
Bucket metrics can be viewed in the Grafana dashboard using the [bucket JSON file on GitHub](https://raw.githubusercontent.com/minio/minio/master/docs/metrics/prometheus/grafana/bucket/minio-bucket.json).
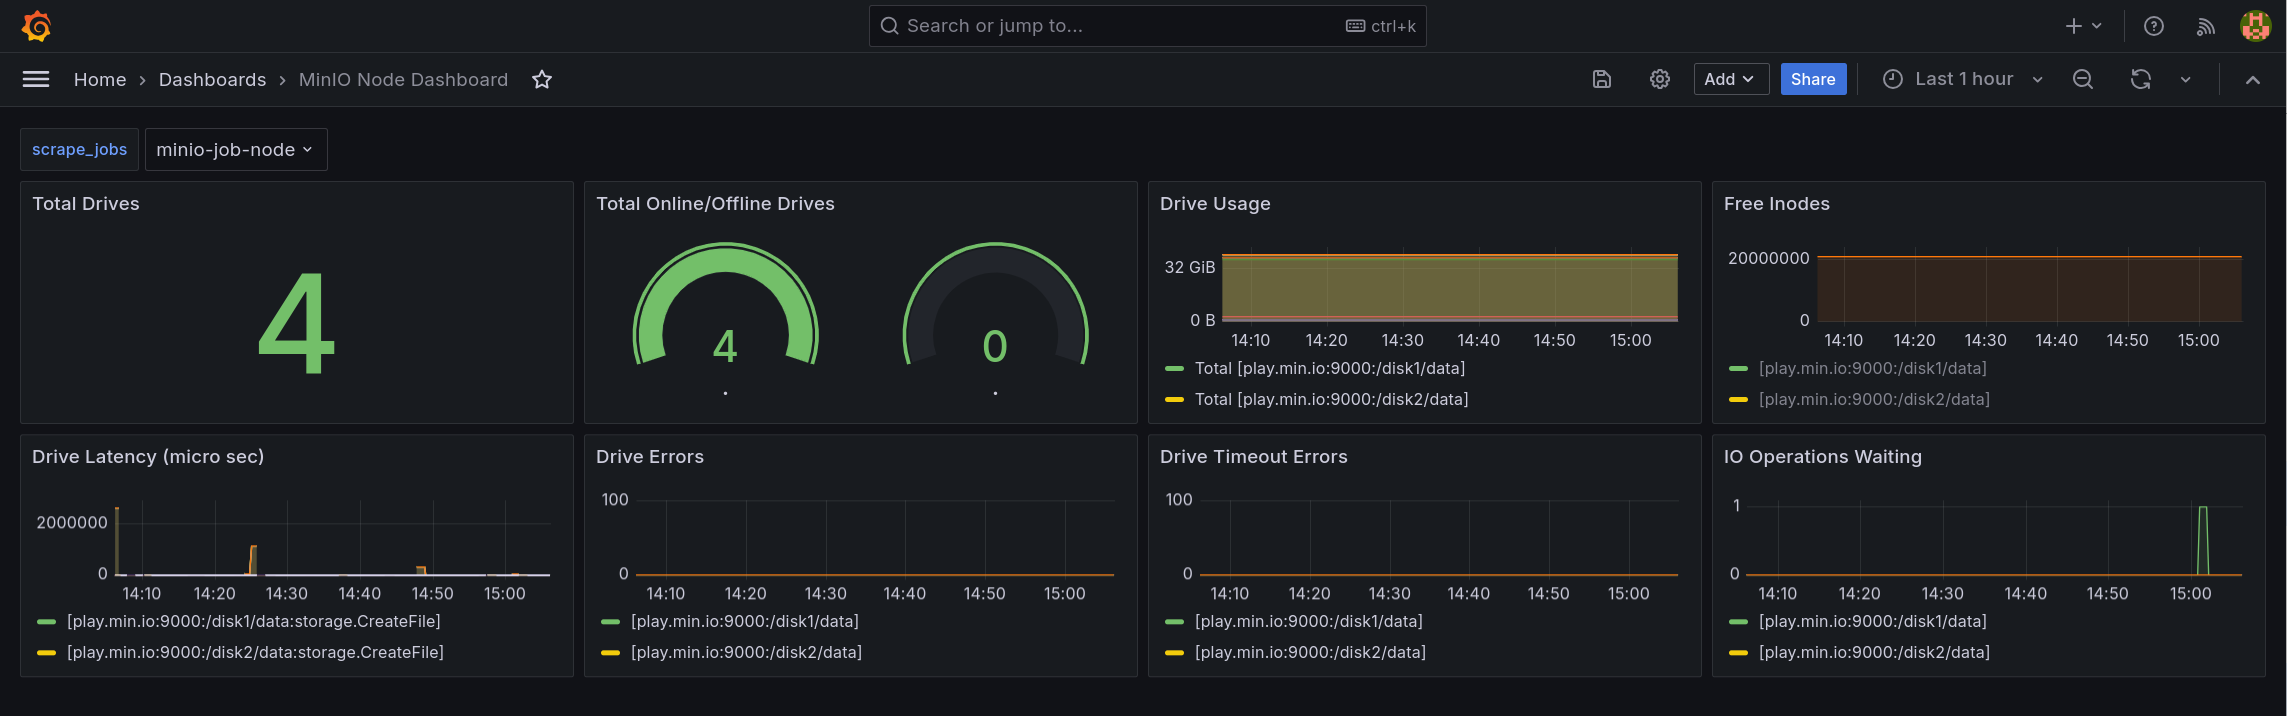
 ### MinIO Node Metrics Dashboard {#minio-node-metrics-dashboard}
Node metrics can be viewed in the Grafana dashboard using the [node JSON file on GitHub](https://raw.githubusercontent.com/minio/minio/master/docs/metrics/prometheus/grafana/node/minio-node.json).
### MinIO Node Metrics Dashboard {#minio-node-metrics-dashboard}
Node metrics can be viewed in the Grafana dashboard using the [node JSON file on GitHub](https://raw.githubusercontent.com/minio/minio/master/docs/metrics/prometheus/grafana/node/minio-node.json).
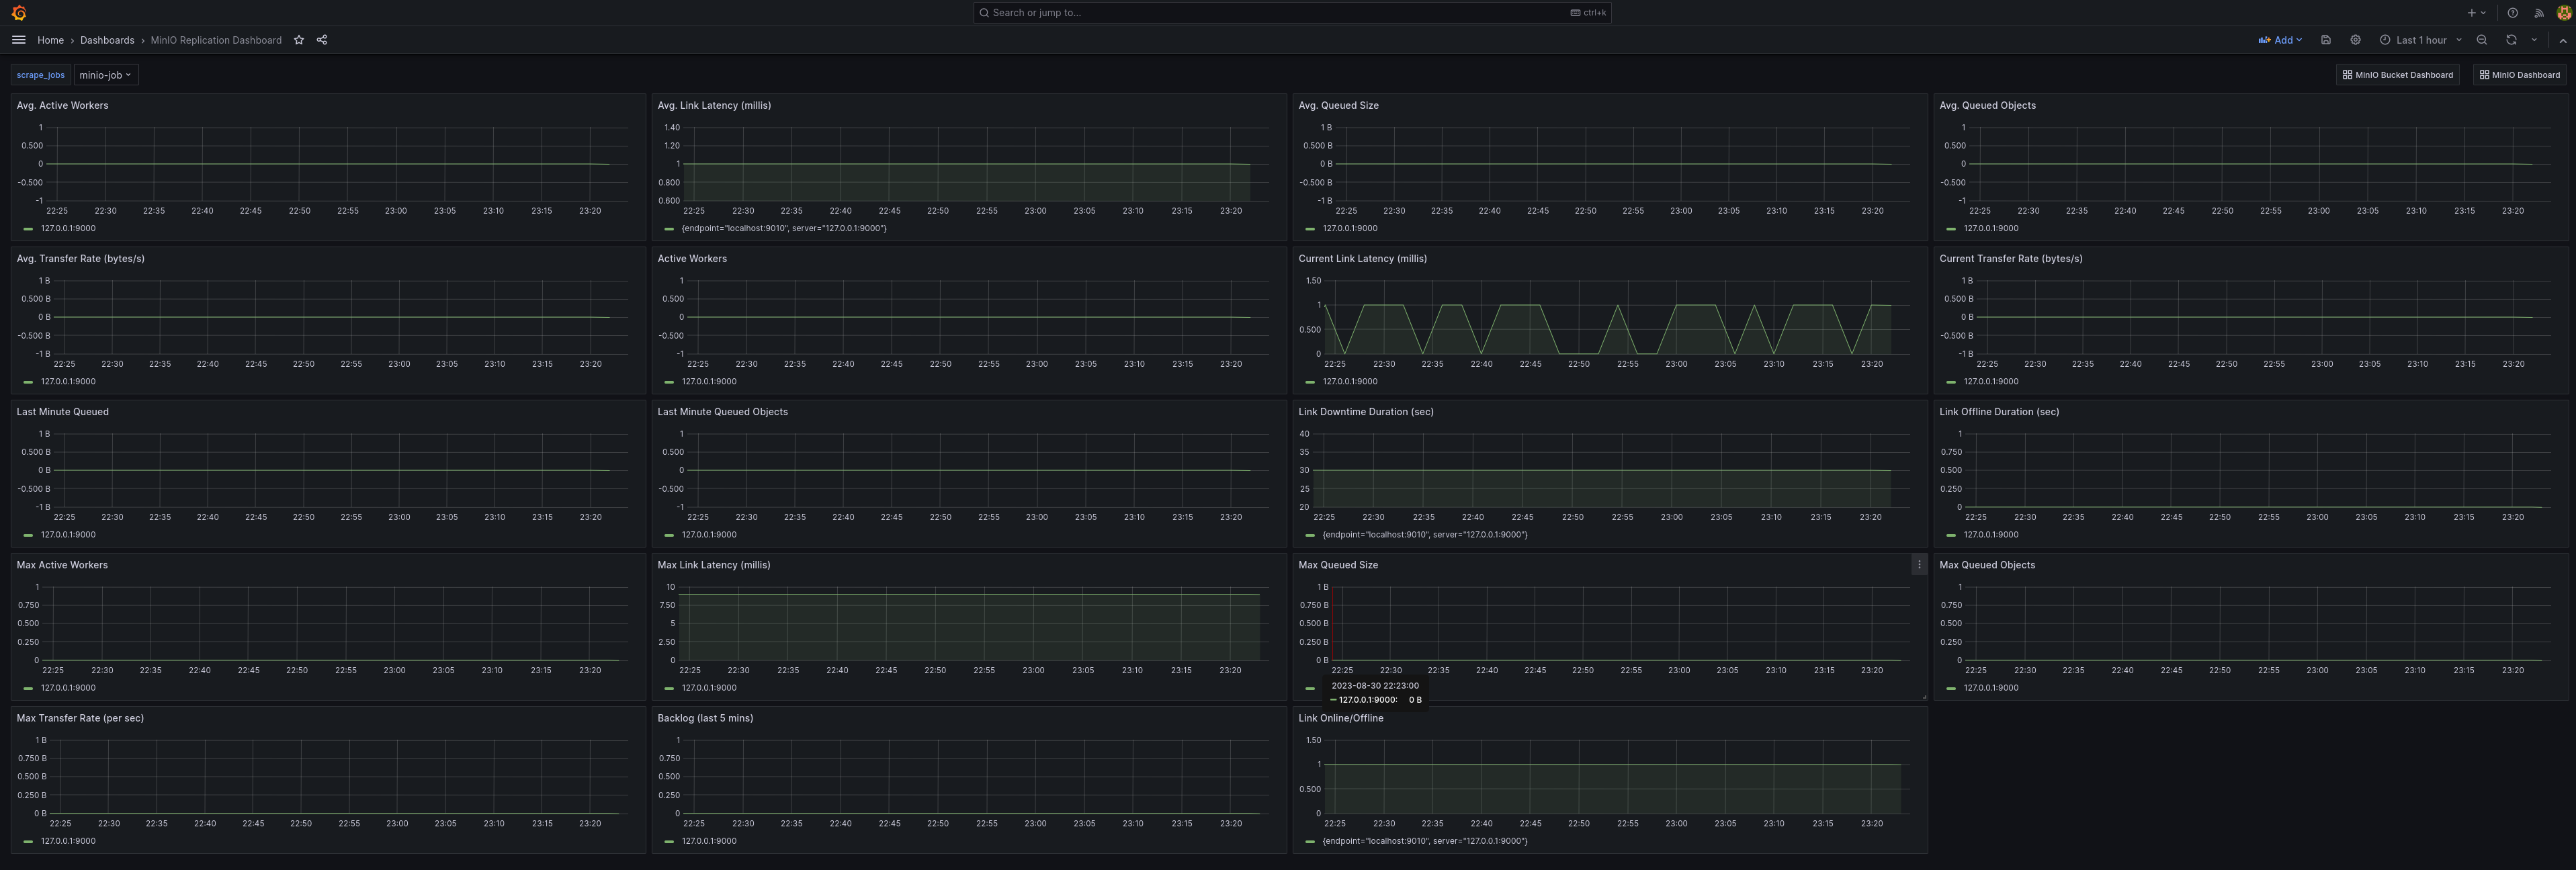
 ### MinIO Replication Metrics Dashboard {#minio-replication-metrics-dashboard}
Use the [MinIO organization catalog on Grafana](https://grafana.com/orgs/minioinc/dashboards) to select a replication dashboard compatible with the metrics version exposed by your deployment.
Cluster replication metrics can be viewed in the Grafana dashboard using the [cluster replication JSON file on GitHub](https://raw.githubusercontent.com/minio/minio/master/docs/metrics/prometheus/grafana/replication/minio-replication-cluster.json).
### MinIO Replication Metrics Dashboard {#minio-replication-metrics-dashboard}
Use the [MinIO organization catalog on Grafana](https://grafana.com/orgs/minioinc/dashboards) to select a replication dashboard compatible with the metrics version exposed by your deployment.
Cluster replication metrics can be viewed in the Grafana dashboard using the [cluster replication JSON file on GitHub](https://raw.githubusercontent.com/minio/minio/master/docs/metrics/prometheus/grafana/replication/minio-replication-cluster.json).