This is the multi-page printable view of this section. .
Monitoring and Alerts
-
1: Metrics and alerts
- 2: Monitoring and Alerting using Prometheus
- 3: Monitoring and Alerting using InfluxDB
- 4: Publish Server or Audit Logs to an External Service
- 5: Healthcheck API
- 6: Metrics version 2
- 7: Monitor a Silo Server with Grafana
Metrics and Alerts
MinIO publishes point-in-time metrics using the Prometheus Data Model. You can use any scraping tool which supports that data model to pull those metrics into a database for populating historical views, performing query/analysis of metrics data, or creating alerts on preferred data points.
The following table lists tutorials for integrating MinIO metrics with select third-party monitoring software.
Configure Prometheus to Monitor and Alert for a MinIO deployment |
|
Configure InfluxDB to Monitor and Alert for a MinIO deployment. |
Other metrics and analytics software suites which support the Prometheus data model may work regardless of their inclusion on the above list.
Logging
MinIO publishes all minio server operations to the system console. MinIO also supports publishing server logs and audit logs to an HTTP webhook.
- Server logs contain the same
minio serveroperations logged to the system console. Server logs support general monitoring and troubleshooting of operations. - Audit logs are more granular descriptions of each operation on the MinIO deployment. Audit logging supports security standards and regulations which require detailed tracking of operations.
MinIO publishes logs as a JSON document as a PUT request to each configured endpoint. The endpoint server is responsible for processing each JSON document. MinIO requires explicit configuration of each webhook endpoint and does not publish logs to a webhook by default.
See Publish Server or Audit Logs to an External Service for more complete documentation.
Healthchecks
MinIO exposes unauthenticated endpoints for probing node uptime and cluster high availability for simple healthchecks. These endpoints return only an HTTP status code. See Healthcheck API for more information.
1 - Metrics and alerts
MinIO publishes metrics using the Prometheus Data Model. You can use any scraping tool to pull metrics data from MinIO for further analysis and alerting.
Starting with MinIO Server RELEASE.2024-07-15T19-02-30Z and MinIO Client RELEASE.2024-07-11T18-01-28Z, metrics version 3 provides additional endpoints. MinIO recommends version 3 for new deployments.
Metrics version 2
Existing deployments can continue to use version 2 metrics and Grafana dashboards.
Version 3 Endpoints
For metrics version 3, all metrics are available under the base /minio/metrics/v3 endpoint. You can scrape the base endpoint to collect all metrics in a single operation, or append an optional path to return a specific category.
Important
The V3 metrics on this page may have gaps, inaccuracies, or incorrect information. Reference the minio/minio repository and review the source code for the most accurate representation of metrics as available.
For example, the following endpoint returns audit metrics:
Replace HOSTNAME:PORT with the FQDN and port of the MinIO deployment. For deployments with a load balancer managing connections between MinIO nodes, specify the address of the load balancer.
By default, MinIO requires authentication to scrape the metrics endpoints. To generate the needed bearer tokens, use mc admin prometheus generate. You can also disable metrics endpoint authentication by setting MINIO_PROMETHEUS_AUTH_TYPE to public.
MinIO provides the following scraping endpoints, relative to the base URL:
Category |
Path |
|---|---|
API |
|
Audit |
|
Cluster |
|
Debug |
|
ILM |
|
Logger webhook |
|
Notification |
|
Replication |
|
Scanner |
|
System |
|
For a complete list of metrics for each endpoint, see Available version 3 metrics.
To enable historical data visualization in MinIO Console, set the following environment variables on each node in the MinIO deployment:
- Set
MINIO_PROMETHEUS_URLto the URL of the Prometheus service - Set
MINIO_PROMETHEUS_JOB_IDto the unique job ID assigned to the collected metrics
Available version 3 metrics
MinIO publishes a number of metrics for clusters, API requests, buckets, and other aspects of the MinIO service:
- API Metrics
- Audit Metrics
- Cluster Metrics
- Debug Metrics
- ILM Metrics
- Logger webhook Metrics
- Notification Metrics
- Replication Metrics
- Scanner Metrics
- System Metrics
Many metrics include labels identifying the resource which generated that metric and other relevant details.
API metrics
Metrics about requests served by the current node.
| Path | Description |
|---|---|
/api/requests |
Metrics over all requests. |
/bucket/api |
Metrics over all requests for a given bucket. |
/api/requests
| Name | Description | Labels |
|---|---|---|
minio_api_requests_rejected_auth_total |
Total number of requests rejected for auth failure. Type: counter |
type, pool_index, server |
minio_api_requests_rejected_header_total |
Total number of requests rejected for invalid header. Type: counter |
type, pool_index, server |
minio_api_requests_rejected_timestamp_total |
Total number of requests rejected for invalid timestamp. Type: counter |
type, pool_index, server |
minio_api_requests_rejected_invalid_total |
Total number of invalid requests. Type: counter |
type, pool_index, server |
minio_api_requests_waiting_total |
Total number of requests in the waiting queue. Type: gauge |
type, pool_index, server |
minio_api_requests_incoming_total |
Total number of incoming requests. Type: gauge |
type, pool_index, server |
minio_api_requests_inflight_total |
Total number of requests currently in flight. Type: gauge |
name, type, pool_index, server |
minio_api_requests_total |
Total number of requests. Type: counter |
name, type, pool_index, server |
minio_api_requests_errors_total |
Total number of requests with 4xx or 5xx errors. Type: counter |
name, type, pool_index, server |
minio_api_requests_5xx_errors_total |
Total number of requests with 5xx errors. Type: counter |
name, type, pool_index, server |
minio_api_requests_4xx_errors_total |
Total number of requests with 4xx errors. Type: counter |
name, type, pool_index, server |
minio_api_requests_canceled_total |
Total number of requests canceled by the client. Type: counter |
name, type, pool_index, server |
minio_api_requests_ttfb_seconds_distribution |
Distribution of time to first byte across API calls. Type: counter |
name, type, le, pool_index, server |
minio_api_requests_traffic_sent_bytes |
Total number of bytes sent. Type: counter |
type, pool_index, server |
minio_api_requests_traffic_received_bytes |
Total number of bytes received. Type: counter |
type, pool_index, server |
/bucket/api
| Name | Description | Labels |
|---|---|---|
minio_bucket_api_traffic_received_bytes |
Total number of bytes sent for a bucket. Type: counter |
bucket, type, server, pool_index |
minio_bucket_api_traffic_sent_bytes |
Total number of bytes received for a bucket. Type: counter |
bucket, type, server, pool_index |
minio_bucket_api_inflight_total |
Total number of requests currently in flight for a bucket. Type: gauge |
bucket, name, type, server, pool_index |
minio_bucket_api_total |
Total number of requests for a bucket. Type: counter |
bucket, name, type, server, pool_index |
minio_bucket_api_canceled_total |
Total number of requests canceled by the client for a bucket. Type: counter |
bucket, name, type, server, pool_index |
minio_bucket_api_4xx_errors_total |
Total number of requests with 4xx errors for a bucket. Type: counter |
bucket, name, type, server, pool_index |
minio_bucket_api_5xx_errors_total |
Total number of requests with 5xx errors for a bucket. Type: counter |
bucket, name, type, server, pool_index |
minio_bucket_api_ttfb_seconds_distribution |
Distribution of time to first byte across API calls for a bucket. Type: counter |
bucket, name, le, type, server, pool_index |
Audit metrics
Metrics about the MinIO audit functionality.
| Path | Description |
|---|---|
/audit |
Metrics related to audit functionality. |
/audit
| Name | Description | Labels |
|---|---|---|
minio_audit_failed_messages |
Total number of messages that failed to send since start. Type: counter |
target_id, server |
minio_audit_target_queue_length |
Number of unsent messages in queue for target. Type: gauge |
target_id, server |
minio_audit_total_messages |
Total number of messages sent since start. Type: counter |
target_id, server |
Cluster metrics
Metrics about an entire MinIO cluster.
| Path | Description |
|---|---|
/cluster/config |
Cluster configuration metrics. |
/cluster/erasure-set |
Erasure set metrics. |
/cluster/health |
Cluster health metrics. |
/cluster/iam |
Cluster iam metrics. |
/cluster/usage/buckets |
Object statistics by bucket. |
/cluster/usage/objects |
Object statistics. |
/cluster/config
| Name | Description | Labels |
|---|---|---|
minio_cluster_config_rrs_parity |
Reduced redundancy storage class parity. Type: gauge |
|
minio_cluster_config_standard_parity |
Standard storage class parity. Type: gauge |
/cluster/erasure-set
| Name | Description | Labels |
|---|---|---|
minio_cluster_erasure_set_overall_write_quorum |
Overall write quorum across pools and sets. Type: gauge |
|
minio_cluster_erasure_set_overall_health |
Overall health across pools and sets (1=healthy, 0=unhealthy). Type: gauge |
|
minio_cluster_erasure_set_read_quorum |
Read quorum for the erasure set in a pool. Type: gauge |
pool_id, set_id |
minio_cluster_erasure_set_write_quorum |
Write quorum for the erasure set in a pool. Type: gauge |
pool_id, set_id |
minio_cluster_erasure_set_online_drives_count |
Count of online drives in the erasure set in a pool. Type: gauge |
pool_id, set_id |
minio_cluster_erasure_set_healing_drives_count |
Count of healing drives in the erasure set in a pool. Type: gauge |
pool_id, set_id |
minio_cluster_erasure_set_health |
Health of the erasure set in a pool (1=healthy, 0=unhealthy). Type: gauge |
pool_id, set_id |
minio_cluster_erasure_set_read_tolerance |
Number of drive failures that can be tolerated without disrupting read operations. Type: gauge |
pool_id, set_id |
minio_cluster_erasure_set_write_tolerance |
Number of drive failures that can be tolerated without disrupting write operations. Type: gauge |
pool_id, set_id |
minio_cluster_erasure_set_read_health |
Health of the erasure set in a pool for read operations (1=healthy, 0=unhealthy). Type: gauge |
pool_id, set_id |
minio_cluster_erasure_set_write_health |
Health of the erasure set in a pool for write operations (1=healthy, 0=unhealthy). Type: gauge |
pool_id, set_id |
/cluster/health
| Name | Description | Labels |
|---|---|---|
minio_cluster_health_drives_offline_count |
Count of offline drives in the cluster. Type: gauge |
|
minio_cluster_health_drives_online_count |
Count of online drives in the cluster. Type: gauge |
|
minio_cluster_health_drives_count |
Count of all drives in the cluster. Type: gauge |
|
minio_cluster_health_nodes_offline_count |
Count of offline nodes in the cluster. Type: gauge |
|
minio_cluster_health_nodes_online_count |
Count of online nodes in the cluster. Type: gauge |
|
minio_cluster_health_capacity_raw_total_bytes |
Total cluster raw storage capacity in bytes. Type: gauge |
|
minio_cluster_health_capacity_raw_free_bytes |
Total cluster raw storage free in bytes. Type: gauge |
|
minio_cluster_health_capacity_usable_total_bytes |
Total cluster usable storage capacity in bytes. Type: gauge |
|
minio_cluster_health_capacity_usable_free_bytes |
Total cluster usable storage free in bytes. Type: gauge |
/cluster/iam
| Name | Description | Labels |
|---|---|---|
minio_cluster_iam_last_sync_duration_millis |
Last successful IAM data sync duration in milliseconds. Type: counter |
|
minio_cluster_iam_plugin_authn_service_failed_requests_minute |
When plugin authentication is configured, returns failed requests count in the last full minute. Type: counter |
|
minio_cluster_iam_plugin_authn_service_last_fail_seconds |
When plugin authentication is configured, returns time (in seconds) since the last failed request to the service. Type: counter |
|
minio_cluster_iam_plugin_authn_service_last_succ_seconds |
When plugin authentication is configured, returns time (in seconds) since the last successful request to the service. Type: counter |
|
minio_cluster_iam_plugin_authn_service_succ_avg_rtt_ms_minute |
When plugin authentication is configured, returns average round-trip time of successful requests in the last full minute. Type: counter |
|
minio_cluster_iam_plugin_authn_service_succ_max_rtt_ms_minute |
When plugin authentication is configured, returns maximum round-trip time of successful requests in the last full minute. Type: counter |
|
minio_cluster_iam_plugin_authn_service_total_requests_minute |
When plugin authentication is configured, returns total requests count in the last full minute. Type: counter |
|
minio_cluster_iam_since_last_sync_millis |
Time (in milliseconds) since last successful IAM data sync. Type: counter |
|
minio_cluster_iam_sync_failures |
Number of failed IAM data syncs since server start. Type: counter |
|
minio_cluster_iam_sync_successes |
Number of successful IAM data syncs since server start. Type: counter |
/cluster/usage/buckets
| Name | Description | Labels |
|---|---|---|
minio_cluster_usage_buckets_since_last_update_seconds |
Time since last update of usage metrics in seconds. Type: gauge |
|
minio_cluster_usage_buckets_total_bytes |
Total bucket size in bytes. Type: gauge |
bucket |
minio_cluster_usage_buckets_objects_count |
Total object count in bucket. Type: gauge |
bucket |
minio_cluster_usage_buckets_versions_count |
Total object versions count in bucket, including delete markers. Type: gauge |
bucket |
minio_cluster_usage_buckets_delete_markers_count |
Total delete markers count in bucket. Type: gauge |
bucket |
minio_cluster_usage_buckets_quota_total_bytes |
Total bucket quota in bytes. Type: gauge |
bucket |
minio_cluster_usage_buckets_object_size_distribution |
Bucket object size distribution. Type: gauge |
range, bucket |
minio_cluster_usage_buckets_object_version_count_distribution |
Bucket object version count distribution. Type: gauge |
range, bucket |
/cluster/usage/objects
| Name | Description | Labels |
|---|---|---|
minio_cluster_usage_objects_since_last_update_seconds |
Time since last update of usage metrics in seconds. Type: gauge |
|
minio_cluster_usage_objects_total_bytes |
Total cluster usage in bytes. Type: gauge |
|
minio_cluster_usage_objects_count |
Total cluster objects count. Type: gauge |
|
minio_cluster_usage_objects_versions_count |
Total cluster object versions count, including delete markers. Type: gauge |
|
minio_cluster_usage_objects_delete_markers_count |
Total cluster delete markers count. Type: gauge |
|
minio_cluster_usage_objects_buckets_count |
Total cluster buckets count. Type: gauge |
|
minio_cluster_usage_objects_size_distribution |
Cluster object size distribution. Type: gauge |
range |
minio_cluster_usage_objects_version_count_distribution |
Cluster object version count distribution. Type: gauge |
range |
Debug metrics
Standard Go runtime metrics from the Prometheus Go Client base collector.
| Path | Description |
|---|---|
/debug/go |
Go runtime metrics. |
ILM metrics
Metrics about the MinIO ILM functionality.
| Path | Description |
|---|---|
/ilm |
Metrics related to ILM functionality. |
/ilm
| Name | Description | Labels |
|---|---|---|
minio_cluster_ilm_expiry_pending_tasks |
Number of pending ILM expiry tasks in the queue. Type: gauge |
server |
minio_cluster_ilm_transition_active_tasks |
Number of active ILM transition tasks. Type: gauge |
server |
minio_cluster_ilm_transition_pending_tasks |
Number of pending ILM transition tasks in the queue. Type: gauge |
server |
minio_cluster_ilm_transition_missed_immediate_tasks |
Number of missed immediate ILM transition tasks. Type: counter |
server |
minio_cluster_ilm_versions_scanned |
Total number of object versions checked for ILM actions since server start. Type: counter |
server |
Logger webhook metrics
Metrics about MinIO logger webhooks.
| Path | Description |
|---|---|
/logger/webhook |
Metrics related to logger webhooks. |
/logger/webhook
| Name | Description | Labels |
|---|---|---|
minio_logger_webhook_failed_messages |
Number of messages that failed to send. Type: counter |
server, name, endpoint |
minio_logger_webhook_queue_length |
Webhook queue length. Type: gauge |
server, name, endpoint |
minio_logger_webhook_total_message |
Total number of messages sent to this target. Type: counter |
server, name, endpoint |
Notification metrics
Metrics about the MinIO notification functionality.
| Path | Description |
|---|---|
/notification |
Metrics related to notification functionality. |
/notification
| Name | Description | Labels |
|---|---|---|
minio_notification_current_send_in_progress |
Number of concurrent async Send calls active to all targets. Type: counter |
server |
minio_notification_events_errors_total |
Total number of events that failed to send to the targets. Type: counter |
server |
minio_notification_events_sent_total |
Total number of events sent to the targets. Type: counter |
server |
minio_notification_events_skipped_total |
Number of events not sent to the targets due to the in-memory queue being full. Type: counter |
server |
Replication metrics
Metrics about MinIO site and bucket replication.
| Path | Description |
|---|---|
/bucket/replication |
Metrics related to bucket replication. |
/replication |
Metrics related to site replication. |
/replication
| Name | Description | Labels |
|---|---|---|
minio_replication_average_active_workers |
Average number of active replication workers. Type: gauge |
server |
minio_replication_average_queued_bytes |
Average number of bytes queued for replication since server start. Type: gauge |
server |
minio_replication_average_queued_count |
Average number of objects queued for replication since server start. Type: gauge |
server |
minio_replication_average_data_transfer_rate |
Average replication data transfer rate in bytes/sec. Type: gauge |
server |
minio_replication_current_active_workers |
Total number of active replication workers. Type: gauge |
server |
minio_replication_current_data_transfer_rate |
Current replication data transfer rate in bytes/sec. Type: gauge |
server |
minio_replication_last_minute_queued_bytes |
Number of bytes queued for replication in the last full minute. Type: gauge |
server |
minio_replication_last_minute_queued_count |
Number of objects queued for replication in the last full minute. Type: gauge |
server |
minio_replication_max_active_workers |
Maximum number of active replication workers seen since server start. Type: gauge |
server |
minio_replication_max_queued_bytes |
Maximum number of bytes queued for replication since server start. Type: gauge |
server |
minio_replication_max_queued_count |
Maximum number of objects queued for replication since server start. Type: gauge |
server |
minio_replication_max_data_transfer_rate |
Maximum replication data transfer rate in bytes/sec since server start. Type: gauge |
server |
minio_replication_recent_backlog_count |
Total number of objects seen in replication backlog in the last 5 minutes Type: gauge |
server |
/bucket/replication
| Name | Description | Labels |
|---|---|---|
minio_bucket_replication_last_hour_failed_bytes |
Total number of bytes on a bucket which failed to replicate at least once in the last hour. Type: gauge |
bucket, server |
minio_bucket_replication_last_hour_failed_count |
Total number of objects on a bucket which failed to replicate in the last hour. Type: gauge |
bucket, server |
minio_bucket_replication_last_minute_failed_bytes |
Total number of bytes on a bucket which failed at least once in the last full minute. Type: gauge |
bucket, server |
minio_bucket_replication_last_minute_failed_count |
Total number of objects on a bucket which failed to replicate in the last full minute. Type: gauge |
bucket, server |
minio_bucket_replication_latency_ms |
Replication latency on a bucket in milliseconds. Type: gauge |
bucket, operation, range, targetArn, server |
minio_bucket_replication_proxied_delete_tagging_requests_total |
Number of DELETE tagging requests proxied to replication target. Type: counter |
bucket, server |
minio_bucket_replication_proxied_get_requests_failures |
Number of failures in GET requests proxied to replication target. Type: counter |
bucket, server |
minio_bucket_replication_proxied_get_requests_total |
Number of GET requests proxied to replication target. Type: counter |
bucket, server |
minio_bucket_replication_proxied_get_tagging_requests_failures |
Number of failures in GET tagging requests proxied to replication target. Type: counter |
bucket, server |
minio_bucket_replication_proxied_get_tagging_requests_total |
Number of GET tagging requests proxied to replication target. Type: counter |
bucket, server |
minio_bucket_replication_proxied_head_requests_failures |
Number of failures in HEAD requests proxied to replication target. Type: counter |
bucket, server |
minio_bucket_replication_proxied_head_requests_total |
Number of HEAD requests proxied to replication target. Type: counter |
bucket, server |
minio_bucket_replication_proxied_put_tagging_requests_failures |
Number of failures in PUT tagging requests proxied to replication target. Type: counter |
bucket, server |
minio_bucket_replication_proxied_put_tagging_requests_total |
Number of PUT tagging requests proxied to replication target. Type: counter |
bucket, server |
minio_bucket_replication_sent_bytes |
Total number of bytes replicated to the target. Type: counter |
bucket, server |
minio_bucket_replication_sent_count |
Total number of objects replicated to the target. Type: counter |
bucket, server |
minio_bucket_replication_total_failed_bytes |
Total number of bytes failed to replicate at least once since server start. Type: counter |
bucket, server |
minio_bucket_replication_total_failed_count |
Total number of objects that failed to replicate since server start. Type: counter |
bucket, server |
minio_bucket_replication_proxied_delete_tagging_requests_failures |
Number of failures in DELETE tagging requests proxied to replication target. Type: counter |
bucket, server |
Scanner metrics
Metrics about the MinIO scanner.
| Path | Description |
|---|---|
/scanner |
Metrics related to the MinIO scanner. |
/scanner
| Name | Description | Labels |
|---|---|---|
minio_scanner_bucket_scans_finished |
Total number of bucket scans completed since server start. Type: counter |
server |
minio_scanner_bucket_scans_started |
Total number of bucket scans started since server start. Type: counter |
server |
minio_scanner_directories_scanned |
Total number of directories scanned since server start. Type: counter |
server |
minio_scanner_last_activity_seconds |
Time elapsed (in seconds) since last scan activity. Type: gauge |
server |
minio_scanner_objects_scanned |
Total number of unique objects scanned since server start. Type: counter |
server |
minio_scanner_versions_scanned |
Total number of object versions scanned since server start. Type: counter |
server |
System metrics
Metrics about the MinIO process and the node.
| Path | Description |
|---|---|
/system/cpu |
Metrics about CPUs on the system. |
/system/drive |
Metrics about drives on the system. |
/system/network/internode |
Metrics about internode requests made by the node. |
/system/memory |
Metrics about memory on the system. |
/system/process |
Standard process metrics. |
/system/drive
| Name | Description | Labels |
|---|---|---|
minio_system_drive_used_bytes |
Total storage used on a drive in bytes. Type: gauge |
drive, set_index, drive_index, pool_index, server |
minio_system_drive_free_bytes |
Total storage free on a drive in bytes. Type: gauge |
drive, set_index, drive_index, pool_index, server |
minio_system_drive_total_bytes |
Total storage available on a drive in bytes. Type: gauge |
drive, set_index, drive_index, pool_index, server |
minio_system_drive_used_inodes |
Total used inodes on a drive. Type: gauge |
drive, set_index, drive_index, pool_index, server |
minio_system_drive_free_inodes |
Total free inodes on a drive. Type: gauge |
drive, set_index, drive_index, pool_index, server |
minio_system_drive_total_inodes |
Total inodes available on a drive. Type: gauge |
drive, set_index, drive_index, pool_index, server |
minio_system_drive_timeout_errors_total |
Total timeout errors on a drive. Type: counter |
drive, set_index, drive_index, pool_index, server |
minio_system_drive_io_errors_total |
Total I/O errors on a drive. Type: counter |
drive, set_index, drive_index, pool_index, server |
minio_system_drive_availability_errors_total |
Total availability errors (I/O errors, timeouts) on a drive. Type: counter |
drive, set_index, drive_index, pool_index, server |
minio_system_drive_waiting_io |
Total waiting I/O operations on a drive. Type: gauge |
drive, set_index, drive_index, pool_index, server |
minio_system_drive_api_latency_micros |
Average last minute latency in µs for drive API storage operations. Type: gauge |
drive, api, set_index, drive_index, pool_index, server |
minio_system_drive_offline_count |
Count of offline drives. Type: gauge |
pool_index, server |
minio_system_drive_online_count |
Count of online drives. Type: gauge |
pool_index, server |
minio_system_drive_count |
Count of all drives. Type: gauge |
pool_index, server |
minio_system_drive_health |
Drive health (0 = offline, 1 = healthy, 2 = healing). Type: gauge |
drive, set_index, drive_index, pool_index, server |
minio_system_drive_reads_per_sec |
Reads per second on a drive. Type: gauge |
drive, set_index, drive_index, pool_index, server |
minio_system_drive_reads_kb_per_sec |
Kilobytes read per second on a drive. Type: gauge |
drive, set_index, drive_index, pool_index, server |
minio_system_drive_reads_await |
Average time for read requests served on a drive. Type: gauge |
drive, set_index, drive_index, pool_index, server |
minio_system_drive_writes_per_sec |
Writes per second on a drive. Type: gauge |
drive, set_index, drive_index, pool_index, server |
minio_system_drive_writes_kb_per_sec |
Kilobytes written per second on a drive. Type: gauge |
drive, set_index, drive_index, pool_index, server |
minio_system_drive_writes_await |
Average time for write requests served on a drive. Type: gauge |
drive, set_index, drive_index, pool_index, server |
minio_system_drive_perc_util |
Percentage of time the disk was busy. Type: gauge |
drive, set_index, drive_index, pool_index, server |
/system/memory
| Name | Description | Labels |
|---|---|---|
minio_system_memory_used |
Used memory on the node. Type: gauge |
server |
minio_system_memory_used_perc |
Used memory percentage on the node. Type: gauge |
server |
minio_system_memory_free |
Free memory on the node. Type: gauge |
server |
minio_system_memory_total |
Total memory on the node. Type: gauge |
server |
minio_system_memory_buffers |
Buffers memory on the node. Type: gauge |
server |
minio_system_memory_cache |
Cache memory on the node. Type: gauge |
server |
minio_system_memory_shared |
Shared memory on the node. Type: gauge |
server |
minio_system_memory_available |
Available memory on the node. Type: gauge |
server |
/system/cpu
| Name | Description | Labels |
|---|---|---|
minio_system_cpu_avg_idle |
Average CPU idle time. Type: gauge |
server |
minio_system_cpu_avg_iowait |
Average CPU IOWait time. Type: gauge |
server |
minio_system_cpu_load |
CPU load average 1min. Type: gauge |
server |
minio_system_cpu_load_perc |
CPU load average 1min (percentage). Type: gauge |
server |
minio_system_cpu_nice |
CPU nice time. Type: gauge |
server |
minio_system_cpu_steal |
CPU steal time. Type: gauge |
server |
minio_system_cpu_system |
CPU system time. Type: gauge |
server |
minio_system_cpu_user |
CPU user time. Type: gauge |
server |
/system/network/internode
| Name | Description | Labels |
|---|---|---|
minio_system_network_internode_errors_total |
Total number of failed internode calls. Type: counter |
server, pool_index |
minio_system_network_internode_dial_errors_total |
Total number of internode TCP dial timeouts and errors. Type: counter |
server, pool_index |
minio_system_network_internode_dial_avg_time_nanos |
Average dial time of internodes TCP calls in nanoseconds. Type: gauge |
server, pool_index |
minio_system_network_internode_sent_bytes_total |
Total number of bytes sent to other peer nodes. Type: counter |
server, pool_index |
minio_system_network_internode_recv_bytes_total |
Total number of bytes received from other peer nodes. Type: counter |
server, pool_index |
/system/process
| Name | Description | Labels |
|---|---|---|
minio_system_process_locks_read_total |
Number of current READ locks on this peer. Type: gauge |
server |
minio_system_process_locks_write_total |
Number of current WRITE locks on this peer. Type: gauge |
server |
minio_system_process_cpu_total_seconds |
Total user and system CPU time spent in seconds. Type: counter |
server |
minio_system_process_go_routine_total |
Total number of go routines running. Type: gauge |
server |
minio_system_process_io_rchar_bytes |
Total bytes read by the process from the underlying storage system including cache, /proc/[pid]/io rchar. Type: counter |
server |
minio_system_process_io_read_bytes |
Total bytes read by the process from the underlying storage system, /proc/[pid]/io read_bytes. Type: counter |
server |
minio_system_process_io_wchar_bytes |
Total bytes written by the process to the underlying storage system including page cache, /proc/[pid]/io wchar. Type: counter |
server |
minio_system_process_io_write_bytes |
Total bytes written by the process to the underlying storage system, /proc/[pid]/io write_bytes. Type: counter |
server |
minio_system_process_start_time_seconds |
Start time for MinIO process in seconds since Unix epoch. Type: gauge |
server |
minio_system_process_uptime_seconds |
Uptime for MinIO process in seconds. Type: gauge |
server |
minio_system_process_file_descriptor_limit_total |
Limit on total number of open file descriptors for the MinIO Server process. Type: gauge |
server |
minio_system_process_file_descriptor_open_total |
Total number of open file descriptors by the MinIO Server process. Type: gauge |
server |
minio_system_process_syscall_read_total |
Total read SysCalls to the kernel. /proc/[pid]/io syscr. Type: counter |
server |
minio_system_process_syscall_write_total |
Total write SysCalls to the kernel. /proc/[pid]/io syscw. Type: counter |
server |
minio_system_process_resident_memory_bytes |
Resident memory size in bytes. Type: gauge |
server |
minio_system_process_virtual_memory_bytes |
Virtual memory size in bytes. Type: gauge |
server |
minio_system_process_virtual_memory_max_bytes |
Maximum virtual memory size in bytes. Type: gauge |
server |
2 - Monitoring and Alerting using Prometheus
MinIO publishes cluster, node, bucket, and resource metrics using the Prometheus Data Model. The procedure on this page documents the following:
- Configuring a Prometheus service to scrape and display metrics from a MinIO deployment
- Configuring an Alert Rule on a MinIO Metric to trigger an AlertManager action
These instructions use version 2 metrics. For more about metrics API versions, see Metrics and alerts.
Prerequisites
This procedure requires the following:
- An existing Prometheus deployment with backing Alert Manager
- An existing MinIO deployment with network access to the Prometheus deployment
- An
mcinstallation on your local host configured to access the MinIO deployment
Configure Prometheus to Collect and Alert using MinIO Metrics
1) Generate the Scrape Configuration
Use the mc admin prometheus generate command to generate the scrape configuration for use by Prometheus in making scraping requests:
-
Set an appropriate
scrape_intervalvalue to ensure each scraping operation completes before the next one begins. The recommended value is 60 seconds.Some deployments require a longer scrape interval due to the number of metrics being scraped. To reduce the load on your MinIO and Prometheus servers, choose the longest interval that meets your monitoring requirements.
-
Set the
job_nameto a value associated to the MinIO deployment.Use a unique value to ensure isolation of the deployment metrics from any others collected by that Prometheus service.
-
MinIO deployments started with
MINIO_PROMETHEUS_AUTH_TYPEset to"public"can omit thebearer_tokenfield. -
Set the
schemeto http for MinIO deployments not using TLS. -
Set the
targetsarray with a hostname that resolves to the MinIO deployment.This can be any single node, or a load balancer/proxy which handles connections to the MinIO nodes.
For MinIO Tenants on Kubernetes infrastructure, when using a Prometheus cluster in that same cluster you can specify the service DNS name for the
minioservice. You can otherwise specify the ingress or load balancer endpoint configured to route connections to and from the MinIO Tenant.
2) Restart Prometheus with the Updated Configuration
Append the desired scrape_configs job generated in the previous step to the configuration file:
Cluster metrics aggregate node-level metrics and, where appropriate, attach labels to metrics for the originating node.
Node metrics are specific for node-level monitoring. You need to list all MinIO nodes for this configuration.
Start the Prometheus cluster using the configuration file:
3) Analyze Collected Metrics
Prometheus includes an expression browser. You can execute queries here to analyze the collected metrics.
The following query examples return metrics collected by Prometheus every five minutes for a scrape job named minio-job:
MinIO recommends the following as a basic set of metrics to monitor.
See Metrics and alerts for information about all available metrics.
| Metric | Description |
|---|---|
minio_node_drive_free_bytes |
Total storage available on a drive. |
minio_node_drive_free_inodes |
Total free inodes. |
minio_node_drive_latency_us |
Average last minute latency in µs for drive API storage operations. |
minio_node_drive_offline_total |
Total drives offline in this node. |
minio_node_drive_online_total |
Total drives online in this node. |
minio_node_drive_total |
Total drives in this node. |
minio_node_drive_total_bytes |
Total storage on a drive. |
minio_node_drive_used_bytes |
Total storage used on a drive. |
minio_node_drive_errors_timeout |
Total number of drive timeout errors since server start. |
minio_node_drive_errors_availability |
Total number of drive I/O errors, permission denied and timeouts since server start. |
minio_node_drive_io_waiting |
Total number of I/O operations waiting on drive. |
4) Configure an Alert Rule using MinIO Metrics
You must configure Alert Rules on the Prometheus deployment to trigger alerts based on collected MinIO metrics.
The following example alert rule files provide a baseline of alerts for a MinIO deployment. You can modify or otherwise use these examples as guidance in building your own alerts.
In the Prometheus configuration, specify the path to the alert file in the rule_files key:
Once triggered, Prometheus sends the alert to the configured AlertManager service.
Dashboards
MinIO provides Grafana Dashboards to display metrics collected by Prometheus. For more information, see Monitor a MinIO Server with Grafana
3 - Monitoring and Alerting using InfluxDB
MinIO publishes cluster and node metrics using the Prometheus Data Model. InfluxDB supports scraping MinIO metrics data for monitoring and alerting.
The procedure on this page documents the following:
- Configuring an InfluxDB service to scrape and display metrics from a MinIO deployment
- Configuring an Alert on a MinIO metric
Prerequisites
This procedure requires the following:
- An existing InfluxDB deployment configured with one or more notification endpoints
- An existing MinIO deployment with network access to the InfluxDB deployment
- An
mcinstallation on your local host configured to access the MinIO deployment
These instructions use version 2 metrics. For more about metrics API versions, see Metrics and alerts.
For MinIO Deployments on Kubernetes, this procedure assumes all necessary network control components, such as Ingress or Load Balancers, to facilitate access between the MinIO Tenant and the InfluxDB service.
Configure InfluxDB to Collect and Alert using MinIO Metrics
Important
This procedure specifically uses the InfluxDB UI to create a scraping endpoint.
The InfluxDB UI does not provide the same level of configuration as using Telegraf and the corresponding Prometheus plugin. Specifically:
- You cannot enable authenticated access to the MinIO metrics endpoint via the InfluxDB UI
- You cannot set a tag for collected metrics (e.g.
url_tag) for uniquely identifying the metrics for a given MinIO deployment
The Telegraf Prometheus plugin also supports Kubernetes-specific features, such as scraping the minio service for a given MinIO Tenant.
Configuring Telegraf is out of scope for this procedure. You can use this procedure as general guidance for configuring Telegraf to scrape MinIO metrics.
-
Configure Public Access to MinIO Metrics
Set the
MINIO_PROMETHEUS_AUTH_TYPEenvironment variable to"public"for all nodes in the MinIO deployment. You can then restart the deployment to allow public access to MinIO metrics.You can validate the change by attempting to
curlthe metrics endpoint:Replace
HOSTNAMEwith the URL of the load balancer or reverse proxy through which you access the MinIO deployment. You can alternatively specify any single node asHOSTNAME:PORT, specifying the MinIO server API port in addition to the node hostname.The response body should include a list of collected MinIO metrics.
-
Log into the InfluxDB UI and Create a Bucket
Select the Organization under which you want to store MinIO metrics.
Create a New Bucket in which to store metrics for the MinIO deployment.
-
Create a new Scraping Source
Create a new InfluxDB Scraper.
Specify the full URL to the MinIO deployment, including the metrics endpoint:
Replace
HOSTNAMEwith the URL of the load balancer or reverse proxy through which you access the MinIO deployment. You can alternatively specify any single node asHOSTNAME:PORT, specifying the MinIO server API port in addition to the node hostname. -
Validate the Data
Use the DataExplorer to visualize the collected MinIO data.
For example, you can set a filter on
minio_cluster_capacity_usable_total_bytesandminio_cluster_capacity_usable_free_bytesto compare the total usable against total free space on the MinIO deployment. -
Configure a Check
Create a new Check on a MinIO metric.
The following example check rules provide a baseline of alerts for a MinIO deployment. You can modify or otherwise use these examples for guidance in building your own checks.
-
Create a Threshold Check named
MINIO_NODE_DOWN.Set the filter for the
minio_cluster_nodes_offline_totalkey.Set the Thresholds to WARN when the value is greater than 1
-
Create a Threshold Check named
MINIO_QUORUM_WARNING.Set the filter for the
minio_cluster_drive_offline_totalkey.Set the Thresholds to CRITICAL when the value is one less than your configured Erasure Code Parity setting.
For example, a deployment using EC:4 should set this value to
3.
Configure your Notification endpoints and Notification rules such that checks of each type trigger an appropriate response.
-
4 - Publish Server or Audit Logs to an External Service
MinIO publishes all minio server operations to the system console. Reading these logs depends on how the server process is managed. For example, if the server is managed through a systemd script, you can read the logs using journalctl -u SERVICENAME.service. Replace SERVICENAME with the name of the MinIO service.
MinIO also supports publishing server logs and audit logs to an HTTP webhook.
- Server logs contain the same
minio serveroperations logged to the system console. Server logs support general monitoring and troubleshooting of operations. - Audit logs are more granular descriptions of each operation on the MinIO deployment. Audit logging supports security standards and regulations which require detailed tracking of operations.
MinIO publishes logs as a JSON document as a PUT request to each configured endpoint. The endpoint server is responsible for processing each JSON document. MinIO requires explicit configuration of each webhook endpoint and does not publish logs to a webhook by default.
Publish Server Logs to HTTP Webhook
You can configure a new HTTP webhook endpoint to which MinIO publishes minio server logs using either environment variables or by setting runtime configuration settings.
MinIO supports specifying the minio server log HTTP webhook endpoint and associated configuration settings using environment variables.
The following example code sets all environment variables related to configuring a log HTTP webhook endpoint. The minimum required variables are:
Windows
Linux and macOS
-
Replace
<IDENTIFIER>with a unique descriptive string for the HTTP webhook endpoint. Use the same<IDENTIFIER>for all environment variables related to the new log HTTP webhook.If the specified
<IDENTIFIER>matches an existing log endpoint, the new settings override any existing settings for that endpoint. Usemc admin config get logger_webhookto review the currently configured log HTTP webhook endpoints. -
Replace
https://webhook-1.example.netwith the URL of the HTTP webhook endpoint. -
Replace
TOKENwith an authentication token of the appropriate type for the endpoint. Omit for endpoints which do not require authentication.
To allow for a variety of token types, MinIO creates the request authentication header using the value exactly as specified. Depending on the endpoint, you may need to include additional information.
For example: for a Bearer token, prepend Bearer:
Windows
Linux and macOS
Modify the value according to the endpoint requirements. A custom authentication format could resemble the following:
Windows
Linux and macOS
Consult the documenation for the desired service for more details.
Restart the MinIO server to apply the new configuration settings. You must specify the same environment variables and settings on all MinIO servers in the deployment.
MinIO supports adding or updating log HTTP webhook endpoints on a MinIO deployment using the mc admin config set command and the logger_webhook configuration key. You must restart the MinIO deployment to apply any new or updated configuration settings.
The following example code sets all settings related to configuring a log HTTP webhook endpoint. The minimum required setting is logger_webhook endpoint:
-
Replace
<IDENTIFIER>with a unique descriptive string for the HTTP webhook endpoint. Use the same<IDENTIFIER>for all environment variables related to the new log HTTP webhook.If the specified
<IDENTIFIER>matches an existing log endpoint, the new settings override any existing settings for that endpoint. Usemc admin config get logger_webhookto review the currently configured log HTTP webhook endpoints. -
Replace
https://webhook-1.example.netwith the URL of the HTTP webhook endpoint. -
Replace
TOKENwith an authentication token of the appropriate type for the endpoint. Omit for endpoints which do not require authentication.To allow for a variety of token types, MinIO creates the request authentication header using the value exactly as specified. Depending on the endpoint, you may need to include additional information.
For example: for a Bearer token, prepend
Bearer:Modify the value according to the endpoint requirements. A custom authentication format could resemble the following:
Consult the documenation for the desired service for more details.
Publish Audit Logs to HTTP Webhook
You can configure a new HTTP webhook endpoint to which MinIO publishes audit logs using either environment variables or by setting runtime configuration settings:
MinIO supports specifying the audit log HTTP webhook endpoint and associated configuration settings using environment variables.
The following example code sets all environment variables related to configuring a audit log HTTP webhook endpoint. The minimum required variables are:
Windows
Linux and macOS
-
Replace
<IDENTIFIER>with a unique descriptive string for the HTTP webhook endpoint. Use the same<IDENTIFIER>for all environment variables related to the new audit log HTTP webhook.If the specified
<IDENTIFIER>matches an existing log endpoint, the new settings override any existing settings for that endpoint. Usemc admin config get audit_webhookto review the currently configured audit log HTTP webhook endpoints. -
Replace
https://webhook-1.example.netwith the URL of the HTTP webhook endpoint. -
Replace
TOKENwith an authentication token of the appropriate type for the endpoint. Omit for endpoints which do not require authentication.
To allow for a variety of token types, MinIO creates the request authentication header using the value exactly as specified. Depending on the endpoint, you may need to include additional information.
For example: for a Bearer token, prepend Bearer:
Windows
Linux and macOS
Modify the value according to the endpoint requirements. A custom authentication format could resemble the following:
Windows
Linux and macOS
Consult the documenation for the desired service for more details.
- Replace
cert.pemandcert.keywith the public and private key of the x.509 TLS certificates to present to the HTTP webhook server. Omit for endpoints which do not require clients to present TLS certificates.
Restart the MinIO server to apply the new configuration settings. You must specify the same environment variables and settings on all MinIO servers in the deployment.
MinIO supports adding or updating audit log HTTP webhook endpoints on a MinIO deployment using the mc admin config set command and the audit_webhook configuration key. You must restart the MinIO deployment to apply any new or updated configuration settings.
The following example code sets all settings related to configuring a audit log HTTP webhook endpoint. The minimum required setting is audit_webhook endpoint:
-
Replace
<IDENTIFIER>with a unique descriptive string for the HTTP webhook endpoint. Use the same<IDENTIFIER>for all environment variables related to the new audit log HTTP webhook.If the specified
<IDENTIFIER>matches an existing log endpoint, the new settings override any existing settings for that endpoint. Usemc admin config get audit_webhookto review the currently configured audit log HTTP webhook endpoints. -
Replace
https://webhook-1.example.netwith the URL of the HTTP webhook endpoint. -
Replace
TOKENwith an authentication token of the appropriate type for the endpoint. Omit for endpoints which do not require authentication.To allow for a variety of token types, MinIO creates the request authentication header using the value exactly as specified. Depending on the endpoint, you may need to include additional information.
For example: for a Bearer token, prepend
Bearer:Modify the value according to the endpoint requirements. A custom authentication format could resemble the following:
Consult the documenation for the desired service for more details.
-
Replace
cert.pemandcert.keywith the public and private key of the x.509 TLS certificates to present to the HTTP webhook server. Omit for endpoints which do not require clients to present TLS certificates.
Audit Log Structure
MinIO audit logs resemble the following JSON document:
-
The
api.timeToFirstByteandapi.timeToResponsefields are expressed in nanoseconds. -
For erasure coded setups
tags.objectErasureMapprovides per-object details on the following:- The Server Pool on which the object operation was performed.
- The erasure set on which the object operation was performed.
- The list of drives in the erasure set which participated in the object operation.
5 - Healthcheck API
MinIO exposes unauthenticated endpoints for probing node uptime and cluster high availability for simple healthchecks. These endpoints return an HTTP status code indicating whether the underlying resource is healthy or satisfies read/write quorum. MinIO exposes no other data through these endpoints.
Node Liveness
Use the following endpoint to test if a MinIO server is online:
Replace https://minio.example.net:9000 with the DNS hostname of the MinIO server to check.
A response code of 200 OK indicates the MinIO server is online and functional. Any other HTTP codes indicate an issue with reaching the server, such as a transient network issue or potential downtime.
The healthcheck probe alone cannot determine if a MinIO server is offline. Instead, the probe determines whether the current host machine can reach the server. Consider configuring a Prometheus alert using minio_cluster_health_nodes_offline_count for metrics v3 or minio_cluster_nodes_offline_total for metrics v2 to detect whether one or more MinIO nodes are offline.
Cluster Write Quorum
Use the following endpoint to test if a MinIO cluster has write quorum:
Replace https://minio.example.net:9000 with the DNS hostname of a node in the MinIO cluster to check. For clusters using a load balancer to manage incoming connections, specify the hostname for the load balancer.
A response code of 200 OK indicates that the MinIO cluster has sufficient MinIO servers online to meet write quorum. A response code of 503 Service Unavailable indicates the cluster does not currently have write quorum.
The healthcheck probe alone cannot determine if a MinIO server is offline or processing write operations normally - only whether enough MinIO servers are online to meet write quorum requirements based on the configured erasure code parity. Consider configuring a Prometheus alert using one of the following metrics to detect potential issues or errors on the MinIO cluster:
minio_cluster_nodes_offline_totalto alert if one or more MinIO nodes are offline.minio_node_drive_free_bytesto alert if the cluster is running low on free drive space.
Cluster Read Quorum
Use the following endpoint to test if a MinIO cluster has read quorum:
Replace https://minio.example.net:9000 with the DNS hostname of a node in the MinIO cluster to check. For clusters using a load balancer to manage incoming connections, specify the hostname for the load balancer.
A response code of 200 OK indicates that the MinIO cluster has sufficient MinIO servers online to meet read quorum. A response code of 503 Service Unavailable indicates the cluster does not currently have read quorum.
The healthcheck probe alone cannot determine if a MinIO server is offline or processing read operations normally - only whether enough MinIO servers are online to meet read quorum requirements based on the configured erasure code parity. Consider configuring a Prometheus alert using the minio_cluster_nodes_offline_total metric to detect whether one or more MinIO nodes are offline.
Cluster Maintenance Check
Use the following endpoint to test if the MinIO cluster can maintain both read and write if the specified MinIO server is taken down for maintenance:
Replace https://minio.example.net:9000 with the DNS hostname of a node in the MinIO cluster to check. For clusters using a load balancer to manage incoming connections, specify the hostname for the load balancer.
A response code of 200 OK indicates that the MinIO cluster has sufficient MinIO servers online to meet write quorum. A response code of 412 Precondition Failed indicates the cluster will lose quorum if the MinIO server goes offline.
The healthcheck probe alone cannot determine if a MinIO server is offline - only whether enough MinIO servers will be online after taking the node down for maintenance to meet read and write quorum requirements based on the configured erasure code parity. Consider configuring a Prometheus alert using the minio_cluster_nodes_offline_total metric to detect whether one or more MinIO nodes are offline.
6 - Metrics version 2
MinIO publishes cluster and node metrics using the Prometheus Data Model. You can use any scraping tool to pull metrics data from MinIO for further analysis and alerting.
Version 2 Endpoints
Metrics version 2 provides metrics organized into three categories:
Each v2 endpoint returns all metrics for its category. For example, scraping the following endpoint returns all cluster metrics:
The base endpoint alone, /minio/v2/metrics/, returns cluster metrics.
For more flexible scraping and a wider range of metrics, use metrics version 3.
Existing deployments can continue to use version 2 metrics and Grafana dashboards.
MinIO Grafana dashboard
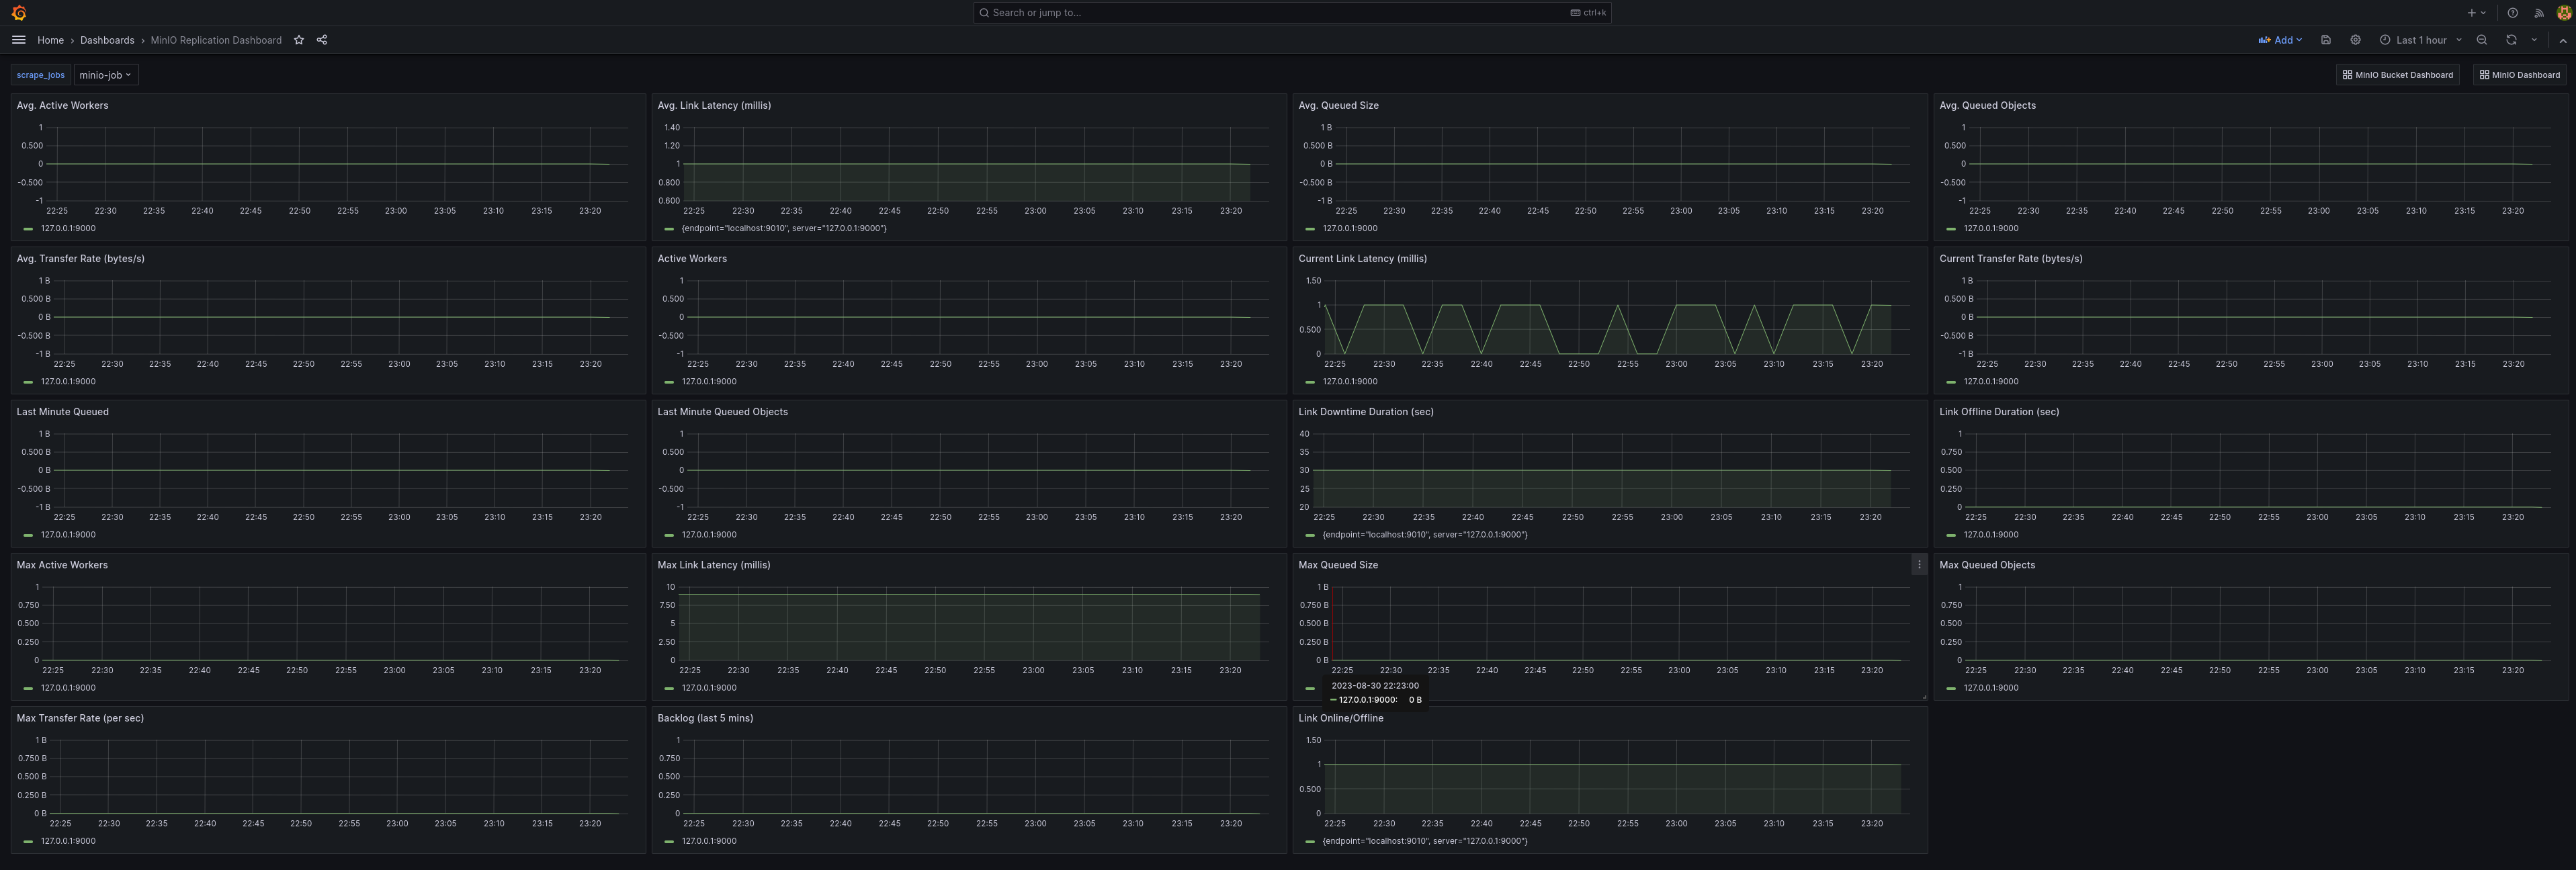
MinIO publishes two Grafana Dashboards for visualizing v2 metrics. For more complete documentation on configuring a Prometheus-compatible data source for Grafana, see the Prometheus documentation on Grafana Support.
Available version 2 metrics
The following sections describe the version 2 endpoints and metrics.
You can scrape cluster-level metrics using the following URL endpoint:
Replace HOSTNAME:PORT with the FQDN and port of the MinIO deployment. For deployments with a load balancer managing connections between MinIO nodes, specify the address of the load balancer.
Changed: MinIO
RELEASE.2023-07-21T21-12-44Z
Bucket metrics have moved to use their own, separate endpoint.
Changed: RELEASE.2023-08-31T15-31-16Z
You can scrape bucket-level metrics using the following URL endpoint:
Changed: RELEASE.2025-03-12T17-29-24Z
v2 metrics have a limit of 100 buckets for performance reasons. For metrics across a higher number of buckets, use v3 metrics instead.
Replace HOSTNAME:PORT with the FQDN and port of the MinIO deployment. For deployments with a load balancer managing connections between MinIO nodes, specify the address of the load balancer.
Added: RELEASE.2023-10-07T15-07-38Z
You can scrape resource metrics using the following URL endpoint:
Replace HOSTNAME:PORT with the FQDN and port of the MinIO deployment. For deployments with a load balancer managing connections between MinIO nodes, specify the address of the load balancer.
Cluster Metrics
MinIO collects the following metrics at the cluster level. Metrics may include one or more labels, such as the server that calculated that metric.
These metrics can be obtained from any MinIO server once per collection by using the following URL:
Replace HOSTNAME:PORT with the hostname of your MinIO deployment. For deployments behind a load balancer, use the load balancer hostname instead of a single node hostname.
Audit Metrics
| Name | Description |
|---|---|
minio_audit_failed_messages |
Total number of messages that failed to send since start. |
minio_audit_target_queue_length |
Number of unsent messages in queue for target. |
minio_audit_total_messages |
Total number of messages sent since start. |
Cluster Capacity Metrics
| Name | Description |
|---|---|
minio_cluster_capacity_raw_free_bytes |
Total free capacity online in the cluster. |
minio_cluster_capacity_raw_total_bytes |
Total capacity online in the cluster. |
minio_cluster_capacity_usable_free_bytes |
Total free usable capacity online in the cluster. |
minio_cluster_capacity_usable_total_bytes |
Total usable capacity online in the cluster. |
minio_cluster_objects_size_distribution |
Distribution of object sizes across a cluster |
minio_cluster_objects_version_distribution |
Distribution of object versions across a cluster |
minio_cluster_usage_object_total |
Total number of objects in a cluster |
minio_cluster_usage_total_bytes |
Total cluster usage in bytes |
minio_cluster_usage_version_total |
Total number of versions (includes delete marker) in a cluster |
minio_cluster_usage_deletemarker_total |
Total number of delete markers in a cluster |
minio_cluster_bucket_total |
Total number of buckets in the cluster |
Cluster Drive Metrics
| Name | Description |
|---|---|
minio_cluster_drive_offline_total |
Total drives offline in this cluster. |
minio_cluster_drive_online_total |
Total drives online in this cluster. |
minio_cluster_drive_total |
Total drives in this cluster. |
Cluster ILM Metrics
| Name | Description |
|---|---|
minio_cluster_ilm_transitioned_bytes |
Total bytes transitioned to a tier. |
minio_cluster_ilm_transitioned_objects |
Total number of objects transitioned to a tier. |
minio_cluster_ilm_transitioned_versions |
Total number of versions transitioned to a tier. |
Cluster KMS Metrics
| Name | Description |
|---|---|
minio_cluster_kms_online |
Reports whether the KMS is online (1) or offline (0). |
minio_cluster_kms_request_error |
Number of KMS requests that failed due to some error. (HTTP 4xx status code). |
minio_cluster_kms_request_failure |
Number of KMS requests that failed due to some internal failure. (HTTP 5xx status code). |
minio_cluster_kms_request_success |
Number of KMS requests that succeeded. |
minio_cluster_kms_uptime |
The time the KMS has been up and running in seconds. |
Cluster Health Metrics
| Name | Description |
|---|---|
minio_cluster_nodes_offline_total |
Total number of MinIO nodes offline. |
minio_cluster_nodes_online_total |
Total number of MinIO nodes online. |
minio_cluster_write_quorum |
Maximum write quorum across all pools and sets |
minio_cluster_health_status |
Get current cluster health status |
minio_cluster_health_erasure_set_healing_drives |
Count of healing drives in the erasure set |
minio_cluster_health_erasure_set_online_drives |
Count of online drives in the erasure set |
minio_cluster_health_erasure_set_read_quorum |
Get read quorum of the erasure set |
minio_cluster_health_erasure_set_write_quorum |
Get write quorum of the erasure set |
minio_cluster_health_erasure_set_status |
Get current health status of the erasure set |
Cluster Replication Metrics
Metrics marked as Site Replication Only only populate on deployments with Site Replication configurations. For deployments with bucket or batch replication configurations, these metrics populate instead under the Bucket Metrics endpoint.
| Name | Description |
|---|---|
minio_cluster_replication_last_hour_failed_bytes |
(Site Replication Only) Total number of bytes failed at least once to replicate in the last full hour. |
minio_cluster_replication_last_hour_failed_count |
(Site Replication Only) Total number of objects which failed replication in the last full hour. |
minio_cluster_replication_last_minute_failed_bytes |
Total number of bytes failed at least once to replicate in the last full minute. |
minio_cluster_replication_last_minute_failed_count |
Total number of objects which failed replication in the last full minute. |
minio_cluster_replication_total_failed_bytes |
(Site Replication Only) Total number of bytes failed at least once to replicate since server start. |
minio_cluster_replication_total_failed_count |
(Site Replication Only) Total number of objects which failed replication since server start. |
minio_cluster_replication_received_bytes |
(Site Replication Only) Total number of bytes replicated to this cluster from another source cluster. |
minio_cluster_replication_received_count |
(Site Replication Only) Total number of objects received by this cluster from another source cluster. |
minio_cluster_replication_sent_bytes |
(Site Replication Only) Total number of bytes replicated to the target cluster. |
minio_cluster_replication_sent_count |
(Site Replication Only) Total number of objects replicated to the target cluster. |
minio_cluster_replication_credential_errors |
(Site Replication Only) Total number of replication credential errors since server start |
minio_cluster_replication_proxied_get_requests_total |
(Site Replication Only)Number of GET requests proxied to replication target |
minio_cluster_replication_proxied_head_requests_total |
(Site Replication Only)Number of HEAD requests proxied to replication target |
minio_cluster_replication_proxied_delete_tagging_requests_total |
(Site Replication Only)Number of DELETE tagging requests proxied to replication target |
minio_cluster_replication_proxied_get_tagging_requests_total |
(Site Replication Only)Number of GET tagging requests proxied to replication target |
minio_cluster_replication_proxied_put_tagging_requests_total |
(Site Replication Only)Number of PUT tagging requests proxied to replication target |
minio_cluster_replication_proxied_get_requests_failures |
(Site Replication Only)Number of failures in GET requests proxied to replication target |
minio_cluster_replication_proxied_head_requests_failures |
(Site Replication Only)Number of failures in HEAD requests proxied to replication target |
minio_cluster_replication_proxied_delete_tagging_requests_failures |
(Site Replication Only)Number of failures proxying DELETE tagging requests to replication target |
minio_cluster_replication_proxied_get_tagging_requests_failures |
(Site Replication Only)Number of failures proxying GET tagging requests to replication target |
minio_cluster_replication_proxied_put_tagging_requests_failures |
(Site Replication Only)Number of failures proxying PUT tagging requests to replication target |
Node Replication Metrics
Metrics marked as Site Replication Only only populate on deployments with Site Replication configurations. For deployments with bucket or batch replication configurations, these metrics populate instead under the Bucket Metrics endpoint.
| Name | Description |
|---|---|
minio_node_replication_current_active_workers |
Total number of active replication workers |
minio_node_replication_average_active_workers |
Average number of active replication workers |
minio_node_replication_max_active_workers |
Maximum number of active replication workers seen since server start |
minio_node_replication_link_online |
Reports whether the replication link is online (1) or offline (0). |
minio_node_replication_link_offline_duration_seconds |
Total duration of replication link being offline in seconds since last offline event |
minio_node_replication_link_downtime_duration_seconds |
Total downtime of replication link in seconds since server start |
minio_node_replication_average_link_latency_ms |
Average replication link latency in milliseconds |
minio_node_replication_max_link_latency_ms |
Maximum replication link latency in milliseconds seen since server start |
minio_node_replication_current_link_latency_ms |
Current replication link latency in milliseconds |
minio_node_replication_current_transfer_rate |
Current replication transfer rate in bytes/sec |
minio_node_replication_average_transfer_rate |
Average replication transfer rate in bytes/sec |
minio_node_replication_max_transfer_rate |
Maximum replication transfer rate in bytes/sec seen since server start |
minio_node_replication_last_minute_queued_count |
Total number of objects queued for replication in the last full minute |
minio_node_replication_last_minute_queued_bytes |
Total number of bytes queued for replication in the last full minute |
minio_node_replication_average_queued_count |
Average number of objects queued for replication since server start |
minio_node_replication_average_queued_bytes |
Average number of bytes queued for replication since server start |
minio_node_replication_max_queued_bytes |
Maximum number of bytes queued for replication seen since server start |
minio_node_replication_max_queued_count |
Maximum number of objects queued for replication seen since server start |
minio_node_replication_recent_backlog_count |
Total number of objects seen in replication backlog in the last 5 minutes |
Healing Metrics
| Name | Description |
|---|---|
minio_heal_objects_errors_total |
Objects for which healing failed in current self healing run. |
minio_heal_objects_heal_total |
Objects healed in current self healing run. |
minio_heal_objects_total |
Objects scanned in current self healing run. |
minio_heal_time_last_activity_nano_seconds |
Time elapsed (in nano seconds) since last self healing activity. |
Inter Node Metrics
| Name | Description |
|---|---|
minio_inter_node_traffic_dial_avg_time |
Average time of internodes TCP dial calls. |
minio_inter_node_traffic_dial_errors |
Total number of internode TCP dial timeouts and errors. |
minio_inter_node_traffic_errors_total |
Total number of failed internode calls. |
minio_inter_node_traffic_received_bytes |
Total number of bytes received from other peer nodes. |
minio_inter_node_traffic_sent_bytes |
Total number of bytes sent to the other peer nodes. |
Bucket Notification Metrics
| Name | Description |
|---|---|
minio_notify_current_send_in_progress |
Number of concurrent async Send calls active to all targets (deprecated, please use minio_notify_target_current_send_in_progress instead) |
minio_notify_events_errors_total |
Events that were failed to be sent to the targets (deprecated, please use minio_notify_target_failed_events instead) |
minio_notify_events_sent_total |
Total number of events sent to the targets (deprecated, please use minio_notify_target_total_events instead) |
minio_notify_events_skipped_total |
Events that were skipped to be sent to the targets due to the in-memory queue being full |
minio_notify_target_current_send_in_progress |
Number of concurrent async Send calls active to the target |
minio_notify_target_queue_length |
Number of events currently staged in the queue_dir configured for the target. |
minio_notify_target_total_events |
Total number of events sent (or) queued to the target |
S3 API Request Metrics
| Name | Description |
|---|---|
minio_s3_requests_4xx_errors_total |
Total number S3 requests with (4xx) errors. |
minio_s3_requests_5xx_errors_total |
Total number S3 requests with (5xx) errors. |
minio_s3_requests_canceled_total |
Total number S3 requests canceled by the client. |
minio_s3_requests_errors_total |
Total number S3 requests with (4xx and 5xx) errors. |
minio_s3_requests_incoming_total |
Volatile number of total incoming S3 requests. |
minio_s3_requests_inflight_total |
Total number of S3 requests currently in flight. |
minio_s3_requests_rejected_auth_total |
Total number S3 requests rejected for auth failure. |
minio_s3_requests_rejected_header_total |
Total number S3 requests rejected for invalid header. |
minio_s3_requests_rejected_invalid_total |
Total number S3 invalid requests. |
minio_s3_requests_rejected_timestamp_total |
Total number S3 requests rejected for invalid timestamp. |
minio_s3_requests_total |
Total number S3 requests. |
minio_s3_requests_waiting_total |
Number of S3 requests in the waiting queue. |
minio_s3_requests_ttfb_seconds_distribution |
Distribution of the time to first byte across API calls. |
minio_s3_traffic_received_bytes |
Total number of s3 bytes received. |
minio_s3_traffic_sent_bytes |
Total number of s3 bytes sent. |
Software Metrics
| Name | Description |
|---|---|
minio_software_commit_info |
Git commit hash for the MinIO release. |
minio_software_version_info |
MinIO Release tag for the server. |
Drive Metrics
| Name | Description |
|---|---|
minio_node_drive_free_bytes |
Total storage available on a drive. |
minio_node_drive_free_inodes |
Total free inodes. |
minio_node_drive_latency_us |
Average last minute latency in µs for drive API storage operations. |
minio_node_drive_offline_total |
Total drives offline in this node. |
minio_node_drive_online_total |
Total drives online in this node. |
minio_node_drive_total |
Total drives in this node. |
minio_node_drive_total_bytes |
Total storage on a drive. |
minio_node_drive_used_bytes |
Total storage used on a drive. |
minio_node_drive_errors_timeout |
Total number of drive timeout errors since server start |
minio_node_drive_errors_ioerror |
Total number of drive I/O errors since server start |
minio_node_drive_errors_availability |
Total number of drive I/O errors, timeouts since server start |
minio_node_drive_io_waiting |
Total number I/O operations waiting on drive |
Identity and Access Management (IAM) Metrics
| Name | Description |
|---|---|
minio_node_iam_last_sync_duration_millis |
Last successful IAM data sync duration in milliseconds. |
minio_node_iam_since_last_sync_millis |
Time (in milliseconds) since last successful IAM data sync. |
minio_node_iam_sync_failures |
Number of failed IAM data syncs since server start. |
minio_node_iam_sync_successes |
Number of successful IAM data syncs since server start. |
Information Lifecycle Management (ILM) Metrics
| Name | Description |
|---|---|
minio_node_ilm_expiry_pending_tasks |
Number of pending ILM expiry tasks in the queue. |
minio_node_ilm_transition_active_tasks |
Number of active ILM transition tasks. |
minio_node_ilm_transition_pending_tasks |
Number of pending ILM transition tasks in the queue. |
minio_node_ilm_transition_missed_immediate_tasks |
Number of missed immediate ILM transition tasks. |
minio_node_ilm_versions_scanned |
Total number of object versions checked for ilm actions since server start. |
minio_node_ilm_action_count_delete_action |
Total action outcome of lifecycle checks since server start for deleting object |
minio_node_ilm_action_count_delete_version_action |
Total action outcome of lifecycle checks since server start for deleting a version |
minio_node_ilm_action_count_transition_action |
Total action outcome of lifecycle checks since server start for transition of an object |
minio_node_ilm_action_count_transition_version_action |
Total action outcome of lifecycle checks since server start for transition of a particular object version |
minio_node_ilm_action_count_delete_restored_action |
Total action outcome of lifecycle checks since server start for deletion of temporarily restored object |
minio_node_ilm_action_count_delete_restored_version_action |
Total action outcome of lifecycle checks since server start for deletion of a temporarily restored version |
minio_node_ilm_action_count_delete_all_versions_action |
Total action outcome of lifecycle checks since server start for deletion of all versions |
Tier Metrics
| Name | Description |
|---|---|
minio_node_tier_tier_ttlb_seconds_distribution |
Distribution of time to last byte for objects downloaded from warm tier |
minio_node_tier_requests_success |
Number of requests to download object from warm tier that were successful |
minio_node_tier_requests_failure |
Number of requests to download object from warm tier that were failure |
System Metrics
| Name | Description |
|---|---|
minio_node_file_descriptor_limit_total |
Limit on total number of open file descriptors for the MinIO Server process. |
minio_node_file_descriptor_open_total |
Total number of open file descriptors by the MinIO Server process. |
minio_node_go_routine_total |
Total number of go routines running. |
minio_node_io_rchar_bytes |
Total bytes read by the process from the underlying storage system including cache, /proc/[pid]/io rchar. |
minio_node_io_read_bytes |
Total bytes read by the process from the underlying storage system, /proc/[pid]/io read_bytes. |
minio_node_io_wchar_bytes |
Total bytes written by the process to the underlying storage system including page cache, /proc/[pid]/io wchar. |
minio_node_io_write_bytes |
Total bytes written by the process to the underlying storage system, /proc/[pid]/io write_bytes. |
minio_node_process_cpu_total_seconds |
Total user and system CPU time spent in seconds by the process. |
minio_node_process_resident_memory_bytes |
Resident memory size in bytes. |
minio_node_process_virtual_memory_bytes |
Virtual memory size in bytes. |
minio_node_process_starttime_seconds |
Start time for MinIO process per node, time in seconds since Unix epoc. |
minio_node_process_uptime_seconds |
Uptime for MinIO process per node in seconds. |
Scanner Metrics
| Name | Description |
|---|---|
minio_node_scanner_bucket_scans_finished |
Total number of bucket scans finished since server start. |
minio_node_scanner_bucket_scans_started |
Total number of bucket scans started since server start. |
minio_node_scanner_directories_scanned |
Total number of directories scanned since server start. |
minio_node_scanner_objects_scanned |
Total number of unique objects scanned since server start. |
minio_node_scanner_versions_scanned |
Total number of object versions scanned since server start. |
minio_node_syscall_read_total |
Total read SysCalls to the kernel. /proc/[pid]/io syscr. |
minio_node_syscall_write_total |
Total write SysCalls to the kernel. /proc/[pid]/io syscw. |
minio_usage_last_activity_nano_seconds |
Time elapsed (in nano seconds) since last scan activity. |
NoteChanged: RELEASE.2025-03-12T17-29-24Z
v2 metrics have a limit of 100 buckets for performance reasons. For metrics across a higher number of buckets, use v3 metrics instead.
Bucket Metrics
MinIO collects the following metrics at the bucket level. Each metric includes the bucket label to identify the corresponding bucket. Metrics may include one or more additional labels, such as the server that calculated that metric.
These metrics can be obtained from any MinIO server once per collection by using the following URL:
Replace HOSTNAME:PORT with the hostname of your MinIO deployment. For deployments behind a load balancer, use the load balancer hostname instead of a single node hostname.
Distribution Metrics
| Name | Description |
|---|---|
minio_bucket_objects_size_distribution |
Distribution of object sizes in the bucket, includes label for the bucket name. |
minio_bucket_objects_version_distribution |
Distribution of object sizes in a bucket, by number of versions |
Replication Metrics
These metrics only populate on deployments with Bucket Replication or Batch Replication configurations. For deployments with Site Replication configured, select metrics populate under the Cluster Metrics endpoint.
| Name | Description |
|---|---|
minio_bucket_replication_last_minute_failed_bytes |
Total number of bytes failed at least once to replicate in the last full minute. |
minio_bucket_replication_last_minute_failed_count |
Total number of objects which failed replication in the last full minute. |
minio_bucket_replication_last_hour_failed_bytes |
Total number of bytes failed at least once to replicate in the last full hour. |
minio_bucket_replication_last_hour_failed_count |
Total number of objects which failed replication in the last full hour. |
minio_bucket_replication_total_failed_bytes |
Total number of bytes failed at least once to replicate since server start. |
minio_bucket_replication_total_failed_count |
Total number of objects which failed replication since server start. |
minio_bucket_replication_latency_ms |
Replication latency in milliseconds. |
minio_bucket_replication_received_bytes |
Total number of bytes replicated to this bucket from another source bucket. |
minio_bucket_replication_received_count |
Total number of objects received by this bucket from another source bucket. |
minio_bucket_replication_sent_bytes |
Total number of bytes replicated to the target bucket. |
minio_bucket_replication_sent_count |
Total number of objects replicated to the target bucket. |
minio_bucket_replication_credential_errors |
Total number of replication credential errors since server start |
minio_bucket_replication_proxied_get_requests_total |
Number of GET requests proxied to replication target |
minio_bucket_replication_proxied_head_requests_total |
Number of HEAD requests proxied to replication target |
minio_bucket_replication_proxied_delete_tagging_requests_total |
Number of DELETE tagging requests proxied to replication target |
minio_bucket_replication_proxied_get_tagging_requests_total |
Number of GET tagging requests proxied to replication target |
minio_bucket_replication_proxied_put_tagging_requests_total |
Number of PUT tagging requests proxied to replication target |
minio_bucket_replication_proxied_get_requests_failures |
Number of failures in GET requests proxied to replication target |
minio_bucket_replication_proxied_head_requests_failures |
Number of failures in HEAD requests proxied to replication target |
minio_bucket_replication_proxied_delete_tagging_requests_failures |
Number of failures in DELETE tagging proxy requests to replication target |
minio_bucket_replication_proxied_get_tagging_requests_failures |
Number of failures in GET tagging proxy requests to replication target |
minio_bucket_replication_proxied_put_tagging_requests_failures |
Number of failures in PUT tagging proxy requests to replication target |
Traffic Metrics
| Name | Description |
|---|---|
minio_bucket_traffic_received_bytes |
Total number of S3 bytes received for this bucket. |
minio_bucket_traffic_sent_bytes |
Total number of S3 bytes sent for this bucket. |
Usage Metrics
| Name | Description |
|---|---|
minio_bucket_usage_object_total |
Total number of objects. |
minio_bucket_usage_version_total |
Total number of versions (includes delete marker) |
minio_bucket_usage_deletemarker_total |
Total number of delete markers. |
minio_bucket_usage_total_bytes |
Total bucket size in bytes. |
minio_bucket_quota_total_bytes |
Total bucket quota size in bytes. |
Requests Metrics
| Name | Description |
|---|---|
minio_bucket_requests_4xx_errors_total |
Total number of S3 requests with (4xx) errors on a bucket. |
minio_bucket_requests_5xx_errors_total |
Total number of S3 requests with (5xx) errors on a bucket. |
minio_bucket_requests_inflight_total |
Total number of S3 requests currently in flight on a bucket. |
minio_bucket_requests_total |
Total number of S3 requests on a bucket. |
minio_bucket_requests_canceled_total |
Total number S3 requests canceled by the client. |
minio_bucket_requests_ttfb_seconds_distribution |
Distribution of time to first byte across API calls per bucket. |
Resource Metrics
MinIO collects the following resource metrics at the node level. Each metric includes the server label to identify the corresponding node. Metrics may include one or more additional labels, such as the drive path, interface name, etc.
These metrics can be obtained from any MinIO server once per collection by using the following URL:
Replace HOSTNAME:PORT with the hostname of your MinIO deployment. For deployments behind a load balancer, use the load balancer hostname instead of a single node hostname.
Drive Resource Metrics
| Name | Description |
|---|---|
minio_node_drive_total_bytes |
Total bytes on a drive. |
minio_node_drive_used_bytes |
Used bytes on a drive. |
minio_node_drive_total_inodes |
Total inodes on a drive. |
minio_node_drive_used_inodes |
Total inodes used on a drive. |
minio_node_drive_reads_per_sec |
Reads per second on a drive. |
minio_node_drive_reads_kb_per_sec |
Kilobytes read per second on a drive. |
minio_node_drive_reads_await |
Average time for read requests to be served on a drive. |
minio_node_drive_writes_per_sec |
Writes per second on a drive. |
minio_node_drive_writes_kb_per_sec |
Kilobytes written per second on a drive. |
minio_node_drive_writes_await |
Average time for write requests to be served on a drive. |
minio_node_drive_perc_util |
Percentage of time the disk was busy since uptime. |
Network Interface Metrics
| Name | Description |
|---|---|
minio_node_if_rx_bytes |
Bytes received on the interface in 60s. |
minio_node_if_rx_bytes_avg |
Bytes received on the interface in 60s (avg) since uptime. |
minio_node_if_rx_bytes_max |
Bytes received on the interface in 60s (max) since uptime. |
minio_node_if_rx_errors |
Receive errors in 60s. |
minio_node_if_rx_errors_avg |
Receive errors in 60s (avg). |
minio_node_if_rx_errors_max |
Receive errors in 60s (max). |
minio_node_if_tx_bytes |
Bytes transmitted in 60s. |
minio_node_if_tx_bytes_avg |
Bytes transmitted in 60s (avg). |
minio_node_if_tx_bytes_max |
Bytes transmitted in 60s (max). |
minio_node_if_tx_errors |
Transmit errors in 60s. |
minio_node_if_tx_errors_avg |
Transmit errors in 60s (avg). |
minio_node_if_tx_errors_max |
Transmit errors in 60s (max). |
CPU Metrics
| Name | Description |
|---|---|
minio_node_cpu_avg_user |
CPU user time. |
minio_node_cpu_avg_user_avg |
CPU user time (avg). |
minio_node_cpu_avg_user_max |
CPU user time (max). |
minio_node_cpu_avg_system |
CPU system time. |
minio_node_cpu_avg_system_avg |
CPU system time (avg). |
minio_node_cpu_avg_system_max |
CPU system time (max). |
minio_node_cpu_avg_idle |
CPU idle time. |
minio_node_cpu_avg_idle_avg |
CPU idle time (avg). |
minio_node_cpu_avg_idle_max |
CPU idle time (max). |
minio_node_cpu_avg_iowait |
CPU ioWait time. |
minio_node_cpu_avg_iowait_avg |
CPU ioWait time (avg). |
minio_node_cpu_avg_iowait_max |
CPU ioWait time (max). |
minio_node_cpu_avg_nice |
CPU nice time. |
minio_node_cpu_avg_nice_avg |
CPU nice time (avg). |
minio_node_cpu_avg_nice_max |
CPU nice time (max). |
minio_node_cpu_avg_steal |
CPU steam time. |
minio_node_cpu_avg_steal_avg |
CPU steam time (avg). |
minio_node_cpu_avg_steal_max |
CPU steam time (max). |
minio_node_cpu_avg_load1 |
CPU load average 1min. |
minio_node_cpu_avg_load1_avg |
CPU load average 1min (avg). |
minio_node_cpu_avg_load1_max |
CPU load average 1min (max). |
minio_node_cpu_avg_load1_perc |
CPU load average 1min (percentage). |
minio_node_cpu_avg_load1_perc_avg |
CPU load average 1min (percentage) (avg). |
minio_node_cpu_avg_load1_perc_max |
CPU load average 1min (percentage) (max). |
minio_node_cpu_avg_load5 |
CPU load average 5min. |
minio_node_cpu_avg_load5_avg |
CPU load average 5min (avg). |
minio_node_cpu_avg_load5_max |
CPU load average 5min (max). |
minio_node_cpu_avg_load5_perc |
CPU load average 5min (percentage). |
minio_node_cpu_avg_load5_perc_avg |
CPU load average 5min (percentage) (avg). |
minio_node_cpu_avg_load5_perc_max |
CPU load average 5min (percentage) (max). |
minio_node_cpu_avg_load15 |
CPU load average 15min. |
minio_node_cpu_avg_load15_avg |
CPU load average 15min (avg). |
minio_node_cpu_avg_load15_max |
CPU load average 15min (max). |
minio_node_cpu_avg_load15_perc |
CPU load average 15min (percentage). |
minio_node_cpu_avg_load15_perc_avg |
CPU load average 15min (percentage) (avg). |
minio_node_cpu_avg_load15_perc_max |
CPU load average 15min (percentage) (max). |
Memory Metrics
| Name | Description |
|---|---|
minio_node_mem_available |
Available memory on the node. |
minio_node_mem_available_avg |
Available memory on the node (avg). |
minio_node_mem_available_max |
Available memory on the node (max). |
minio_node_mem_buffers |
Buffers memory on the node. |
minio_node_mem_buffers_avg |
Buffers memory on the node (avg). |
minio_node_mem_buffers_max |
Buffers memory on the node (max). |
minio_node_mem_cache |
Cache memory on the node. |
minio_node_mem_cache_avg |
Cache memory on the node (avg). |
minio_node_mem_cache_max |
Cache memory on the node (max). |
minio_node_mem_free |
Free memory on the node. |
minio_node_mem_free_avg |
Free memory on the node (avg). |
minio_node_mem_free_max |
Free memory on the node (max). |
minio_node_mem_shared |
Shared memory on the node. |
minio_node_mem_shared_avg |
Shared memory on the node (avg). |
minio_node_mem_shared_max |
Shared memory on the node (max). |
minio_node_mem_total |
Total memory on the node. |
minio_node_mem_total_avg |
Total memory on the node (avg). |
minio_node_mem_total_max |
Total memory on the node (max). |
minio_node_mem_used |
Used memory on the node. |
minio_node_mem_used_avg |
Used memory on the node (avg). |
minio_node_mem_used_max |
Used memory on the node (max). |
minio_node_mem_used_perc |
Used memory percentage on the node. |
minio_node_mem_used_perc_avg |
Used memory percentage on the node (avg). |
minio_node_mem_used_perc_max |
Used memory percentage on the node (max). |
7 - Monitor a Silo Server with Grafana
Grafana allows you to query, visualize, alert on and understand your metrics no matter where they are stored.
Prerequisites
- An existing Prometheus deployment with backing Alert Manager
- An existing MinIO deployment with network access to the Prometheus deployment
- Grafana installed
Grafana dashboards use metrics version 2
The MinIO Grafana dashboards use metrics version 2. For more about metrics API versions, see Metrics and alerts.
Version 3 metrics require creating your own dashboard. For more information about dashboards, see the Grafana documentation.
MinIO Grafana Dashboard
MinIO provides several official Grafana Dashboards you can download from the Grafana Dashboard portal.
To track changes to the Grafana dashboard, inspect the JSON files for the server or bucket dashboards in the MinIO Server GitHub repository.
MinIO Server Metrics Dashboard
Browse the maintained MinIO dashboards in the MinIO organization catalog on Grafana, then select a server dashboard compatible with the metrics version exposed by your deployment.
MinIO provides a Grafana Dashboard for MinIO Server metrics. For specifics on the dashboard’s configuration, see the JSON file on GitHub.
For MinIO Deployments running with Server-Side Encryption (SSE-KMS or SSE-S3), the dashboard includes metrics for the KMS. These metrics include status, request error rates, and request success rates.
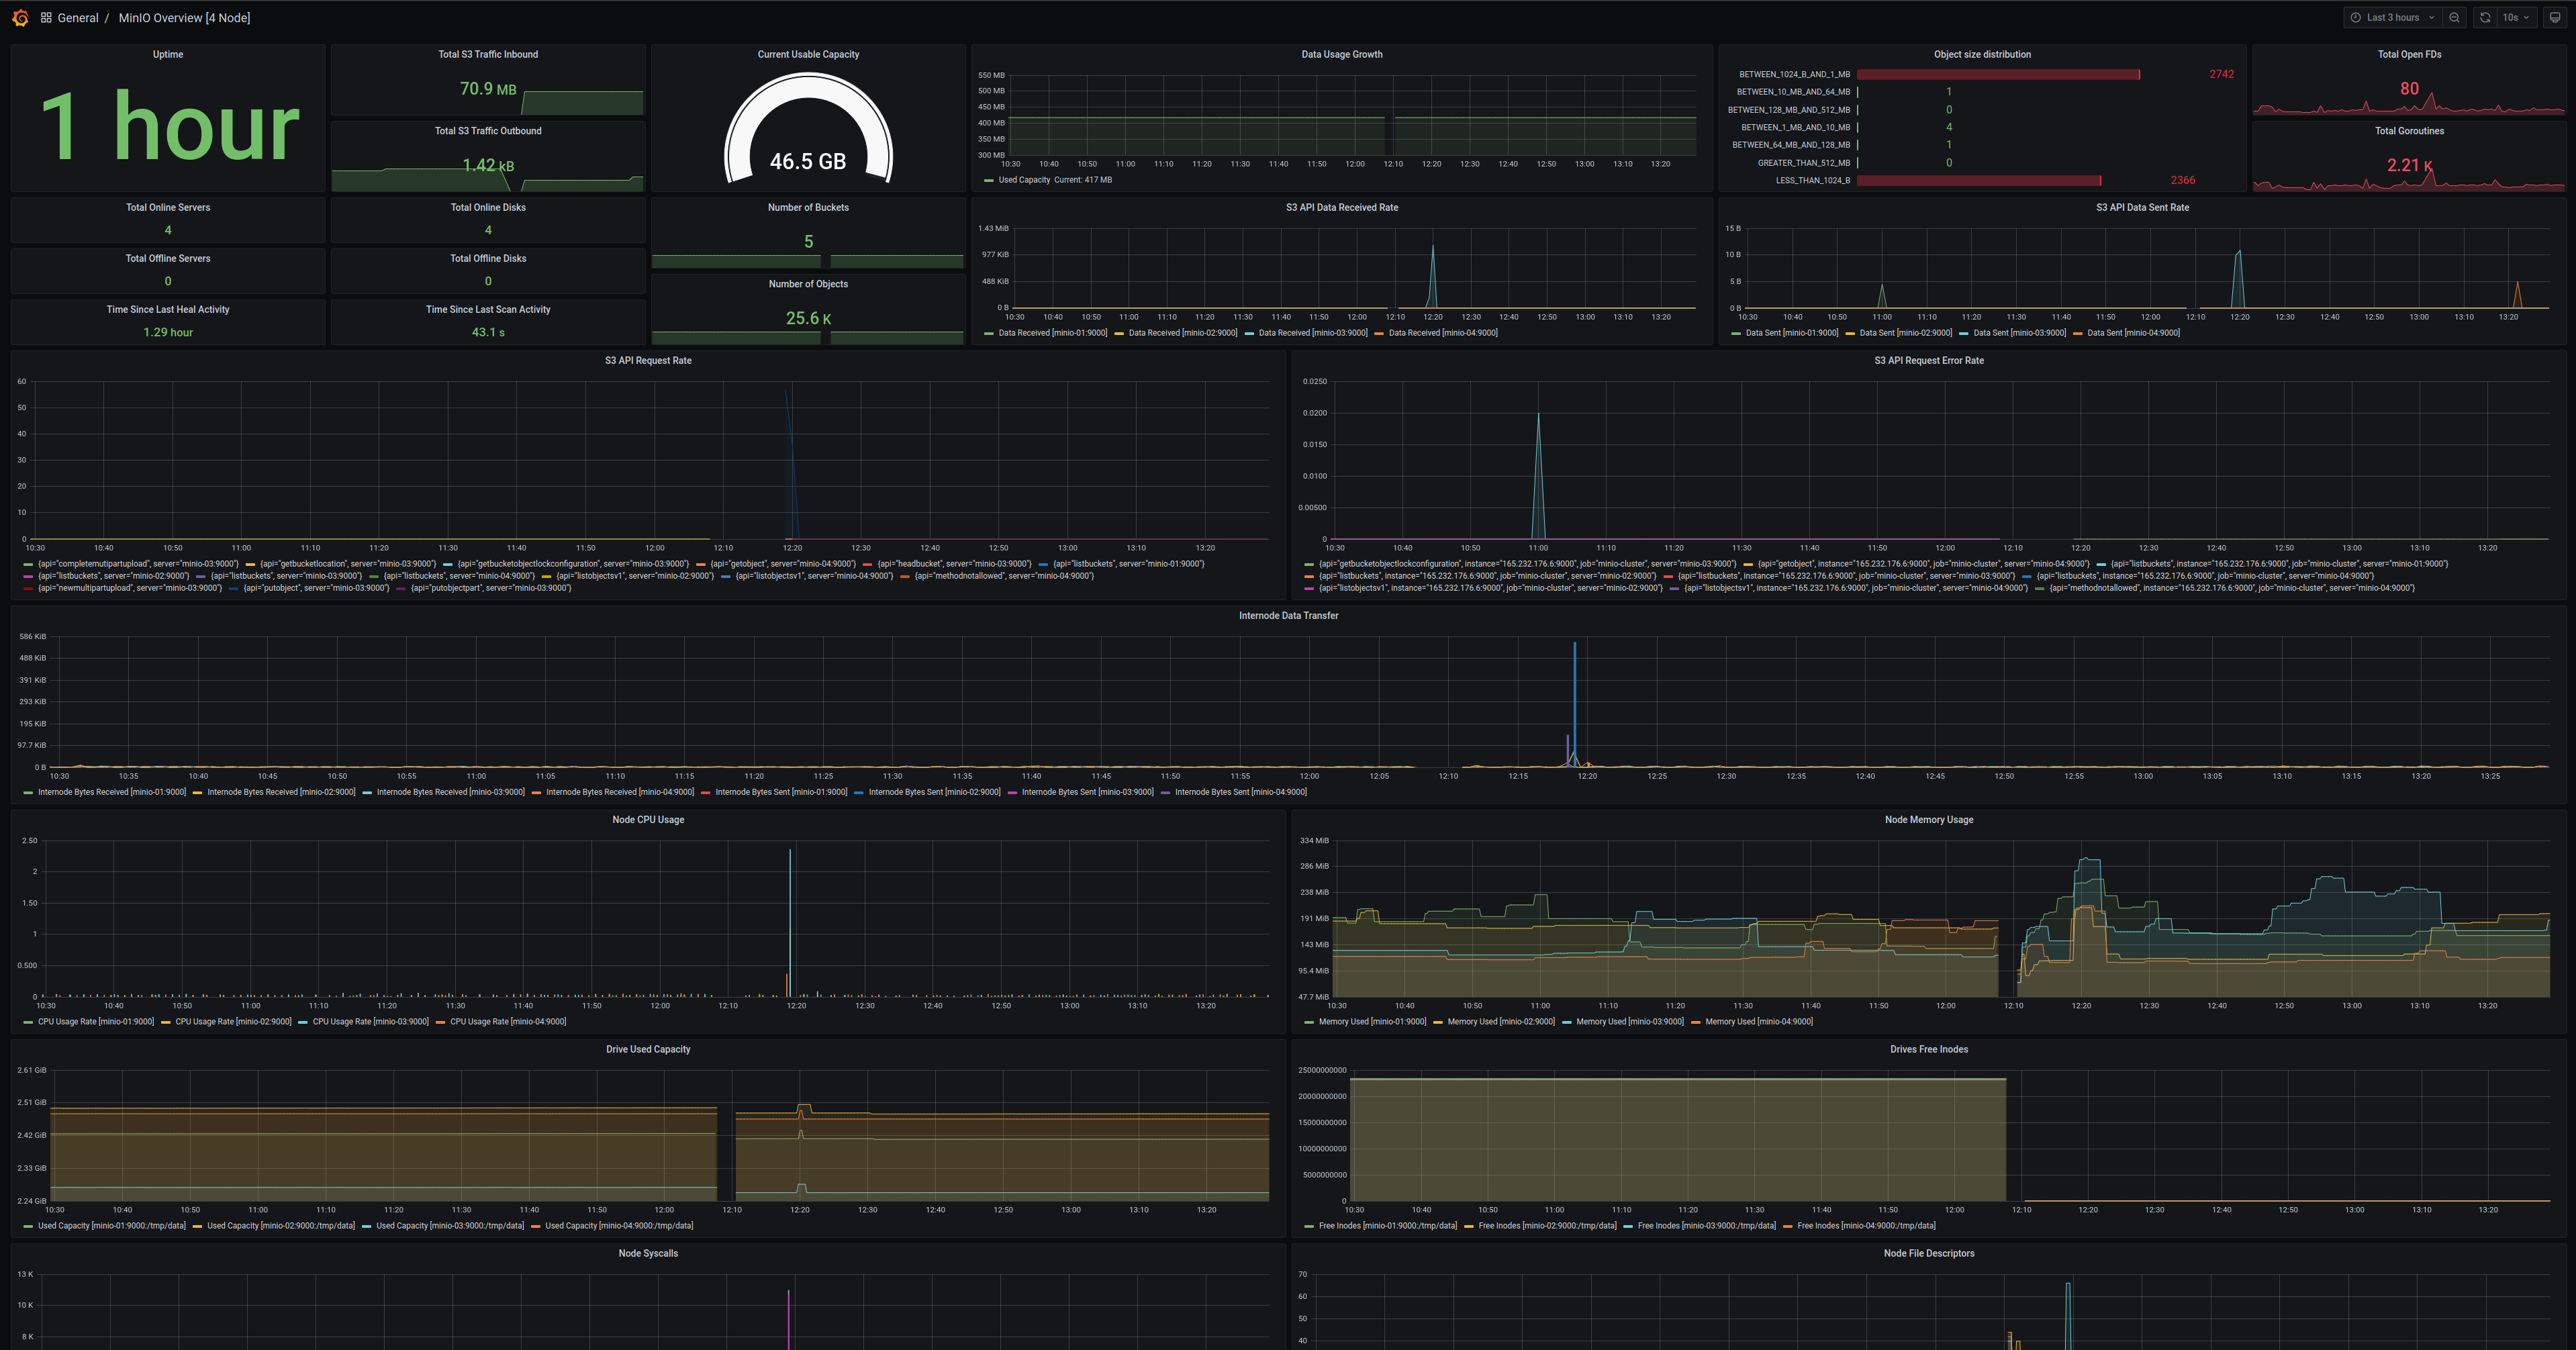
MinIO Bucket Metrics Dashboard
Use the MinIO organization catalog on Grafana to select a bucket dashboard compatible with the metrics version exposed by your deployment.
Bucket metrics can be viewed in the Grafana dashboard using the bucket JSON file on GitHub.
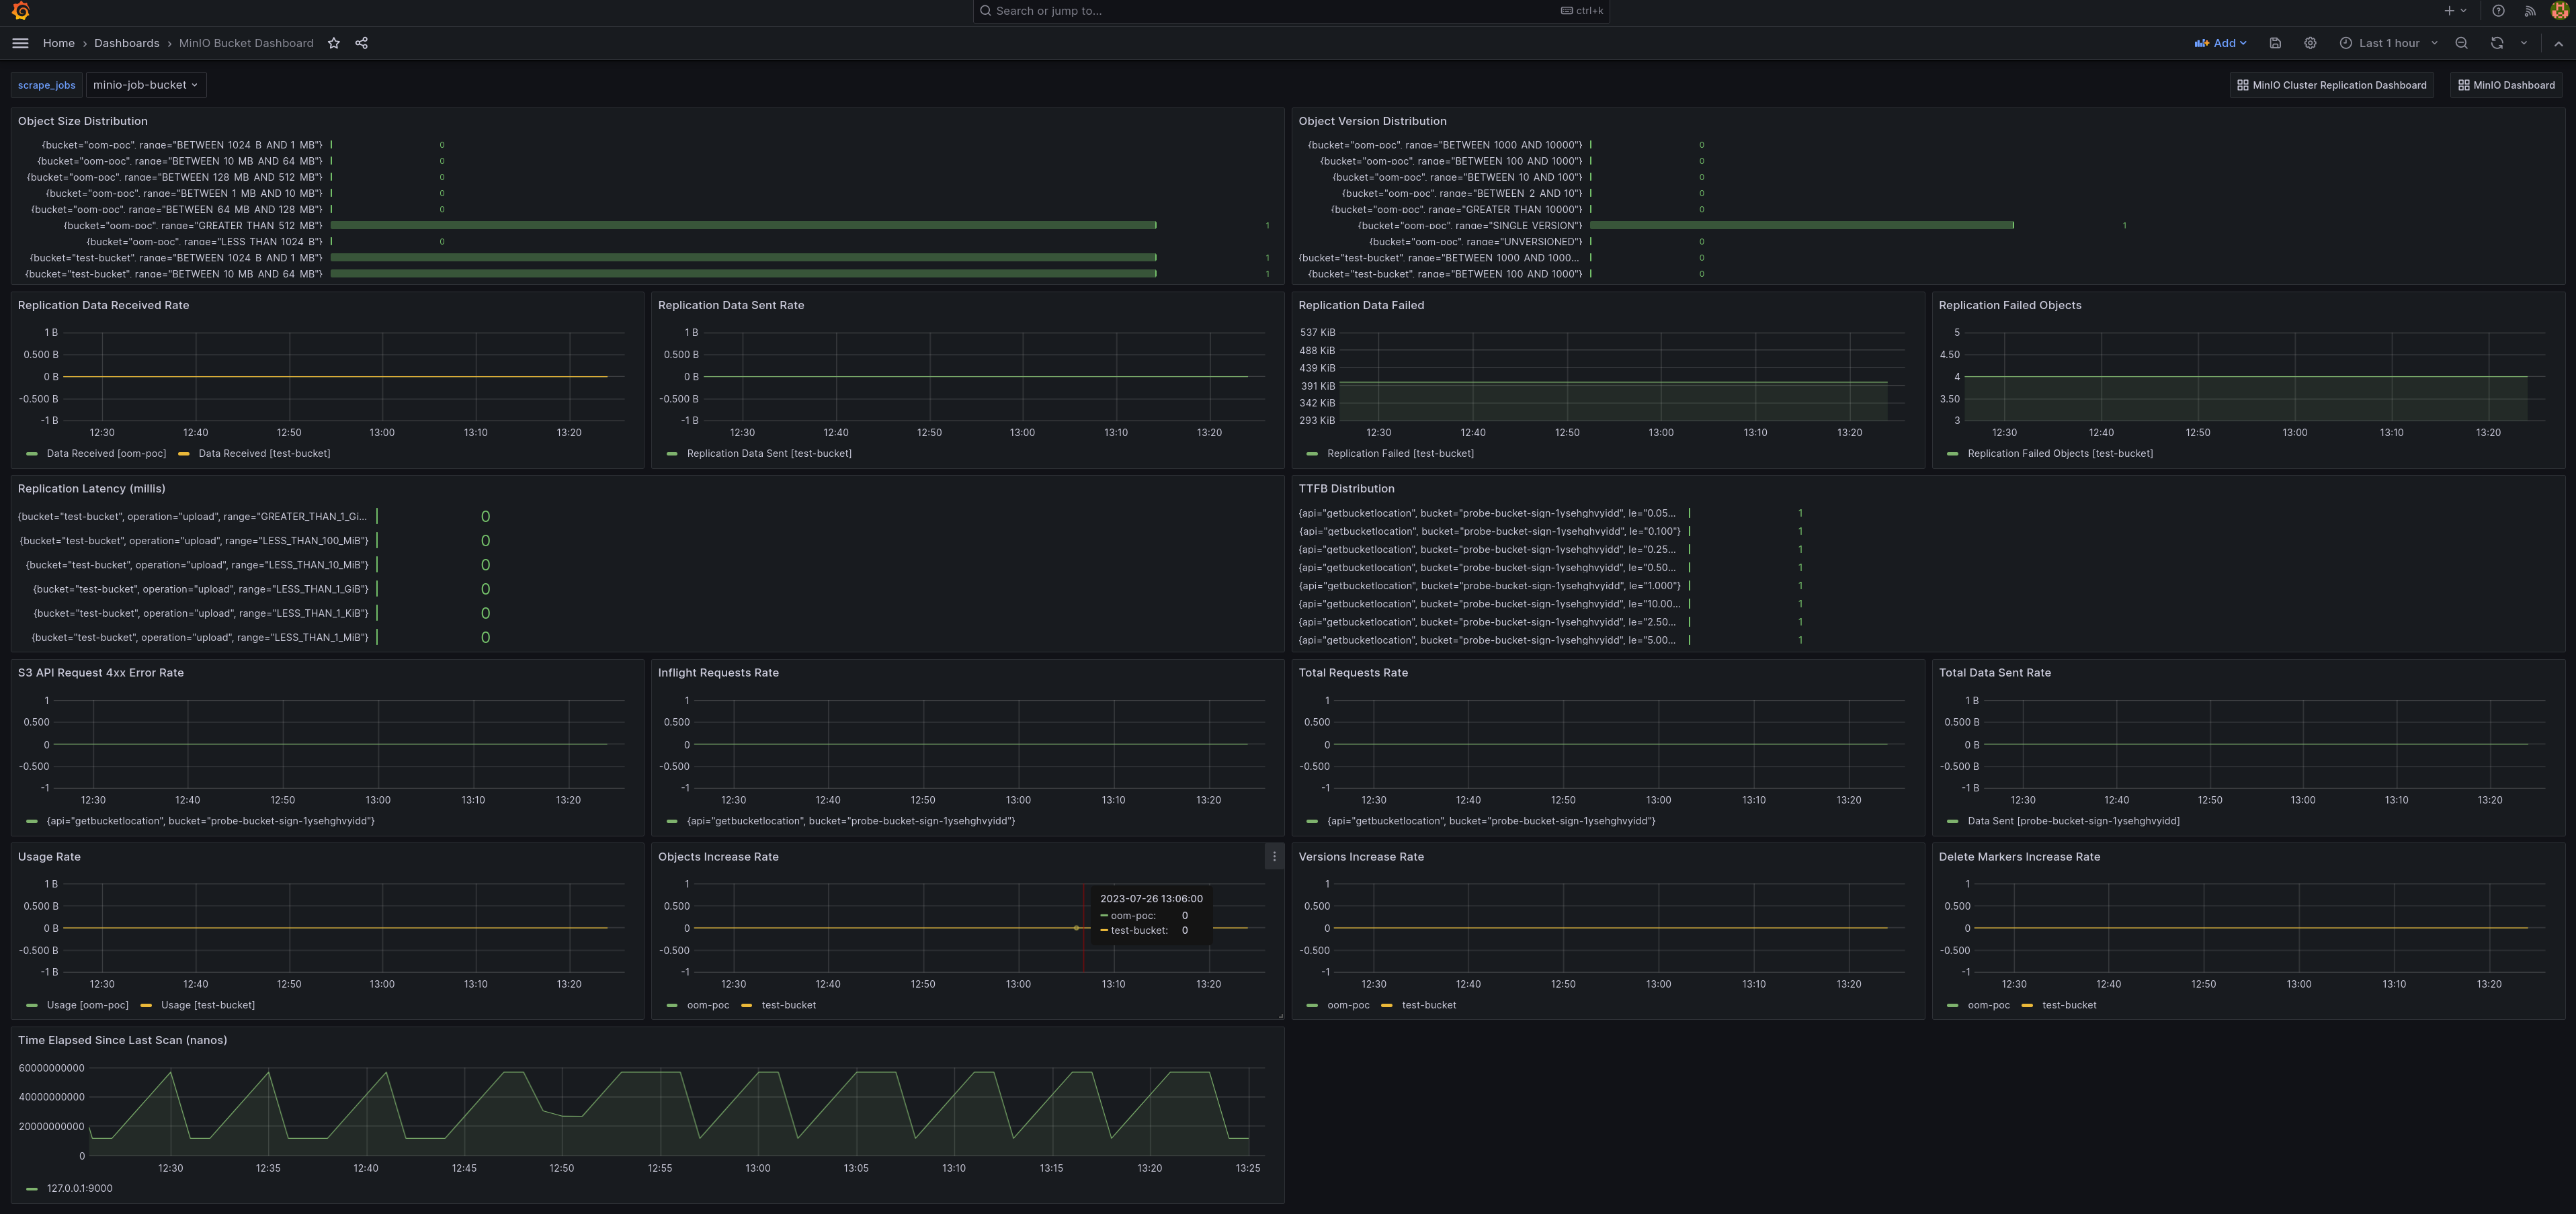
MinIO Node Metrics Dashboard
Node metrics can be viewed in the Grafana dashboard using the node JSON file on GitHub.
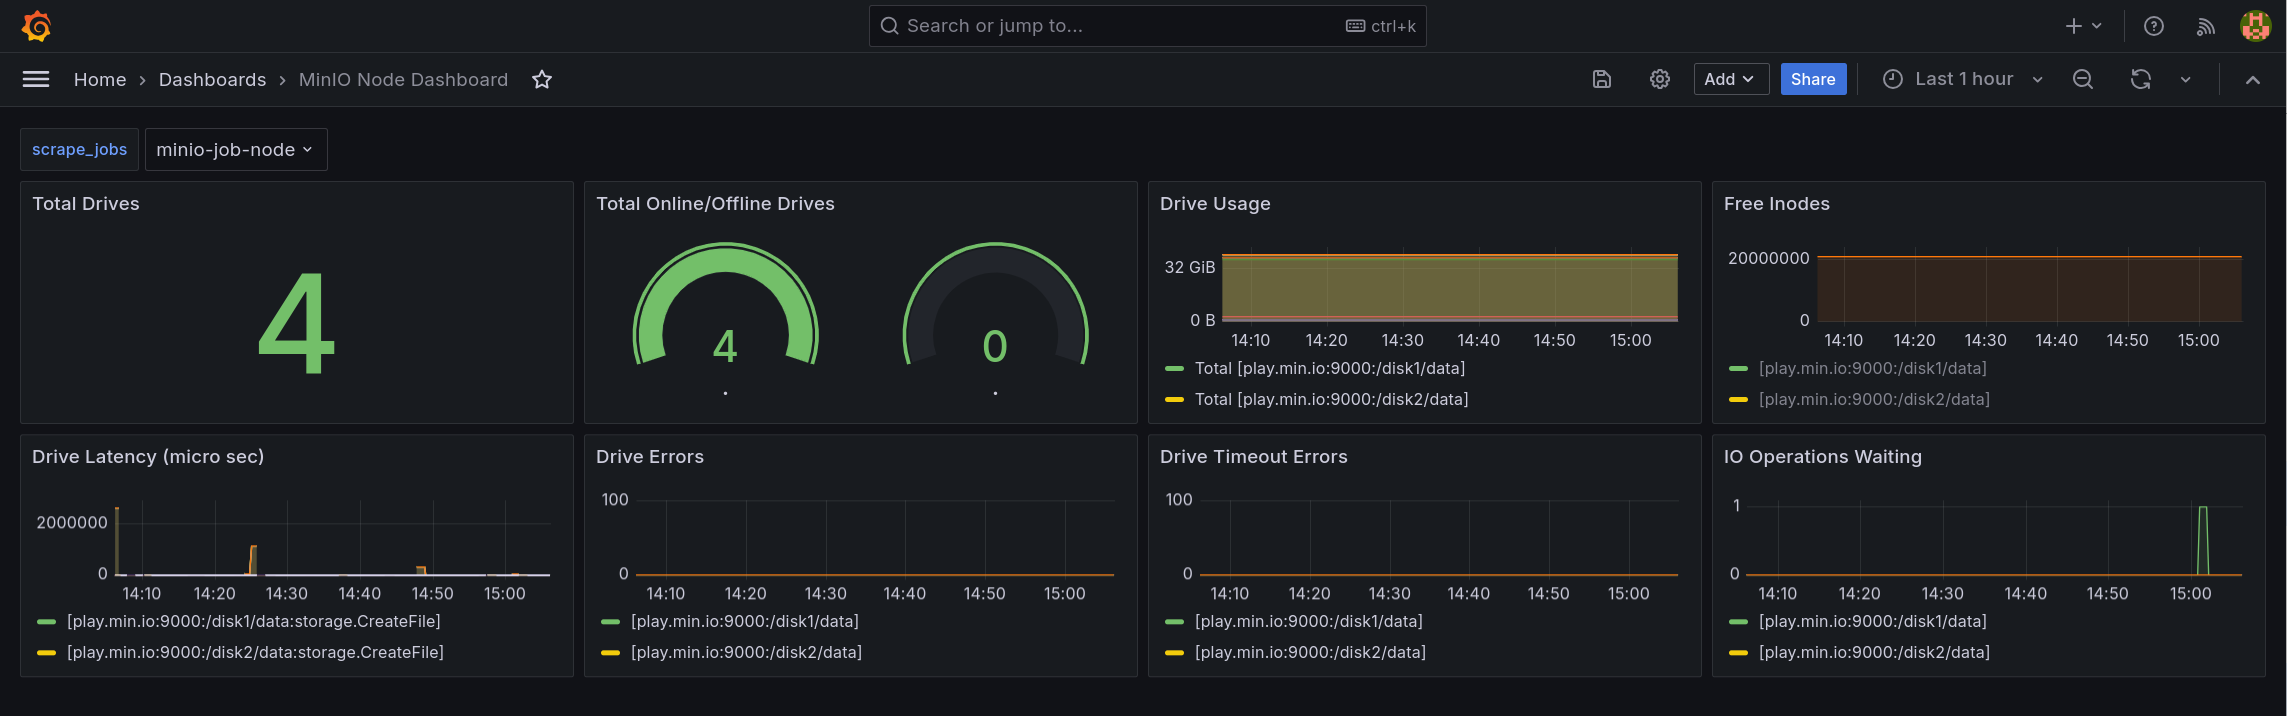
MinIO Replication Metrics Dashboard
Use the MinIO organization catalog on Grafana to select a replication dashboard compatible with the metrics version exposed by your deployment.
Cluster replication metrics can be viewed in the Grafana dashboard using the cluster replication JSON file on GitHub.