Monitor a Silo Server with Grafana
Grafana allows you to query, visualize, alert on and understand your metrics no matter where they are stored.
Prerequisites
- An existing Prometheus deployment with backing Alert Manager
- An existing MinIO deployment with network access to the Prometheus deployment
- Grafana installed
Grafana dashboards use metrics version 2
The MinIO Grafana dashboards use metrics version 2. For more about metrics API versions, see Metrics and alerts.
Version 3 metrics require creating your own dashboard. For more information about dashboards, see the Grafana documentation.
MinIO Grafana Dashboard
MinIO provides several official Grafana Dashboards you can download from the Grafana Dashboard portal.
To track changes to the Grafana dashboard, inspect the JSON files for the server or bucket dashboards in the MinIO Server GitHub repository.
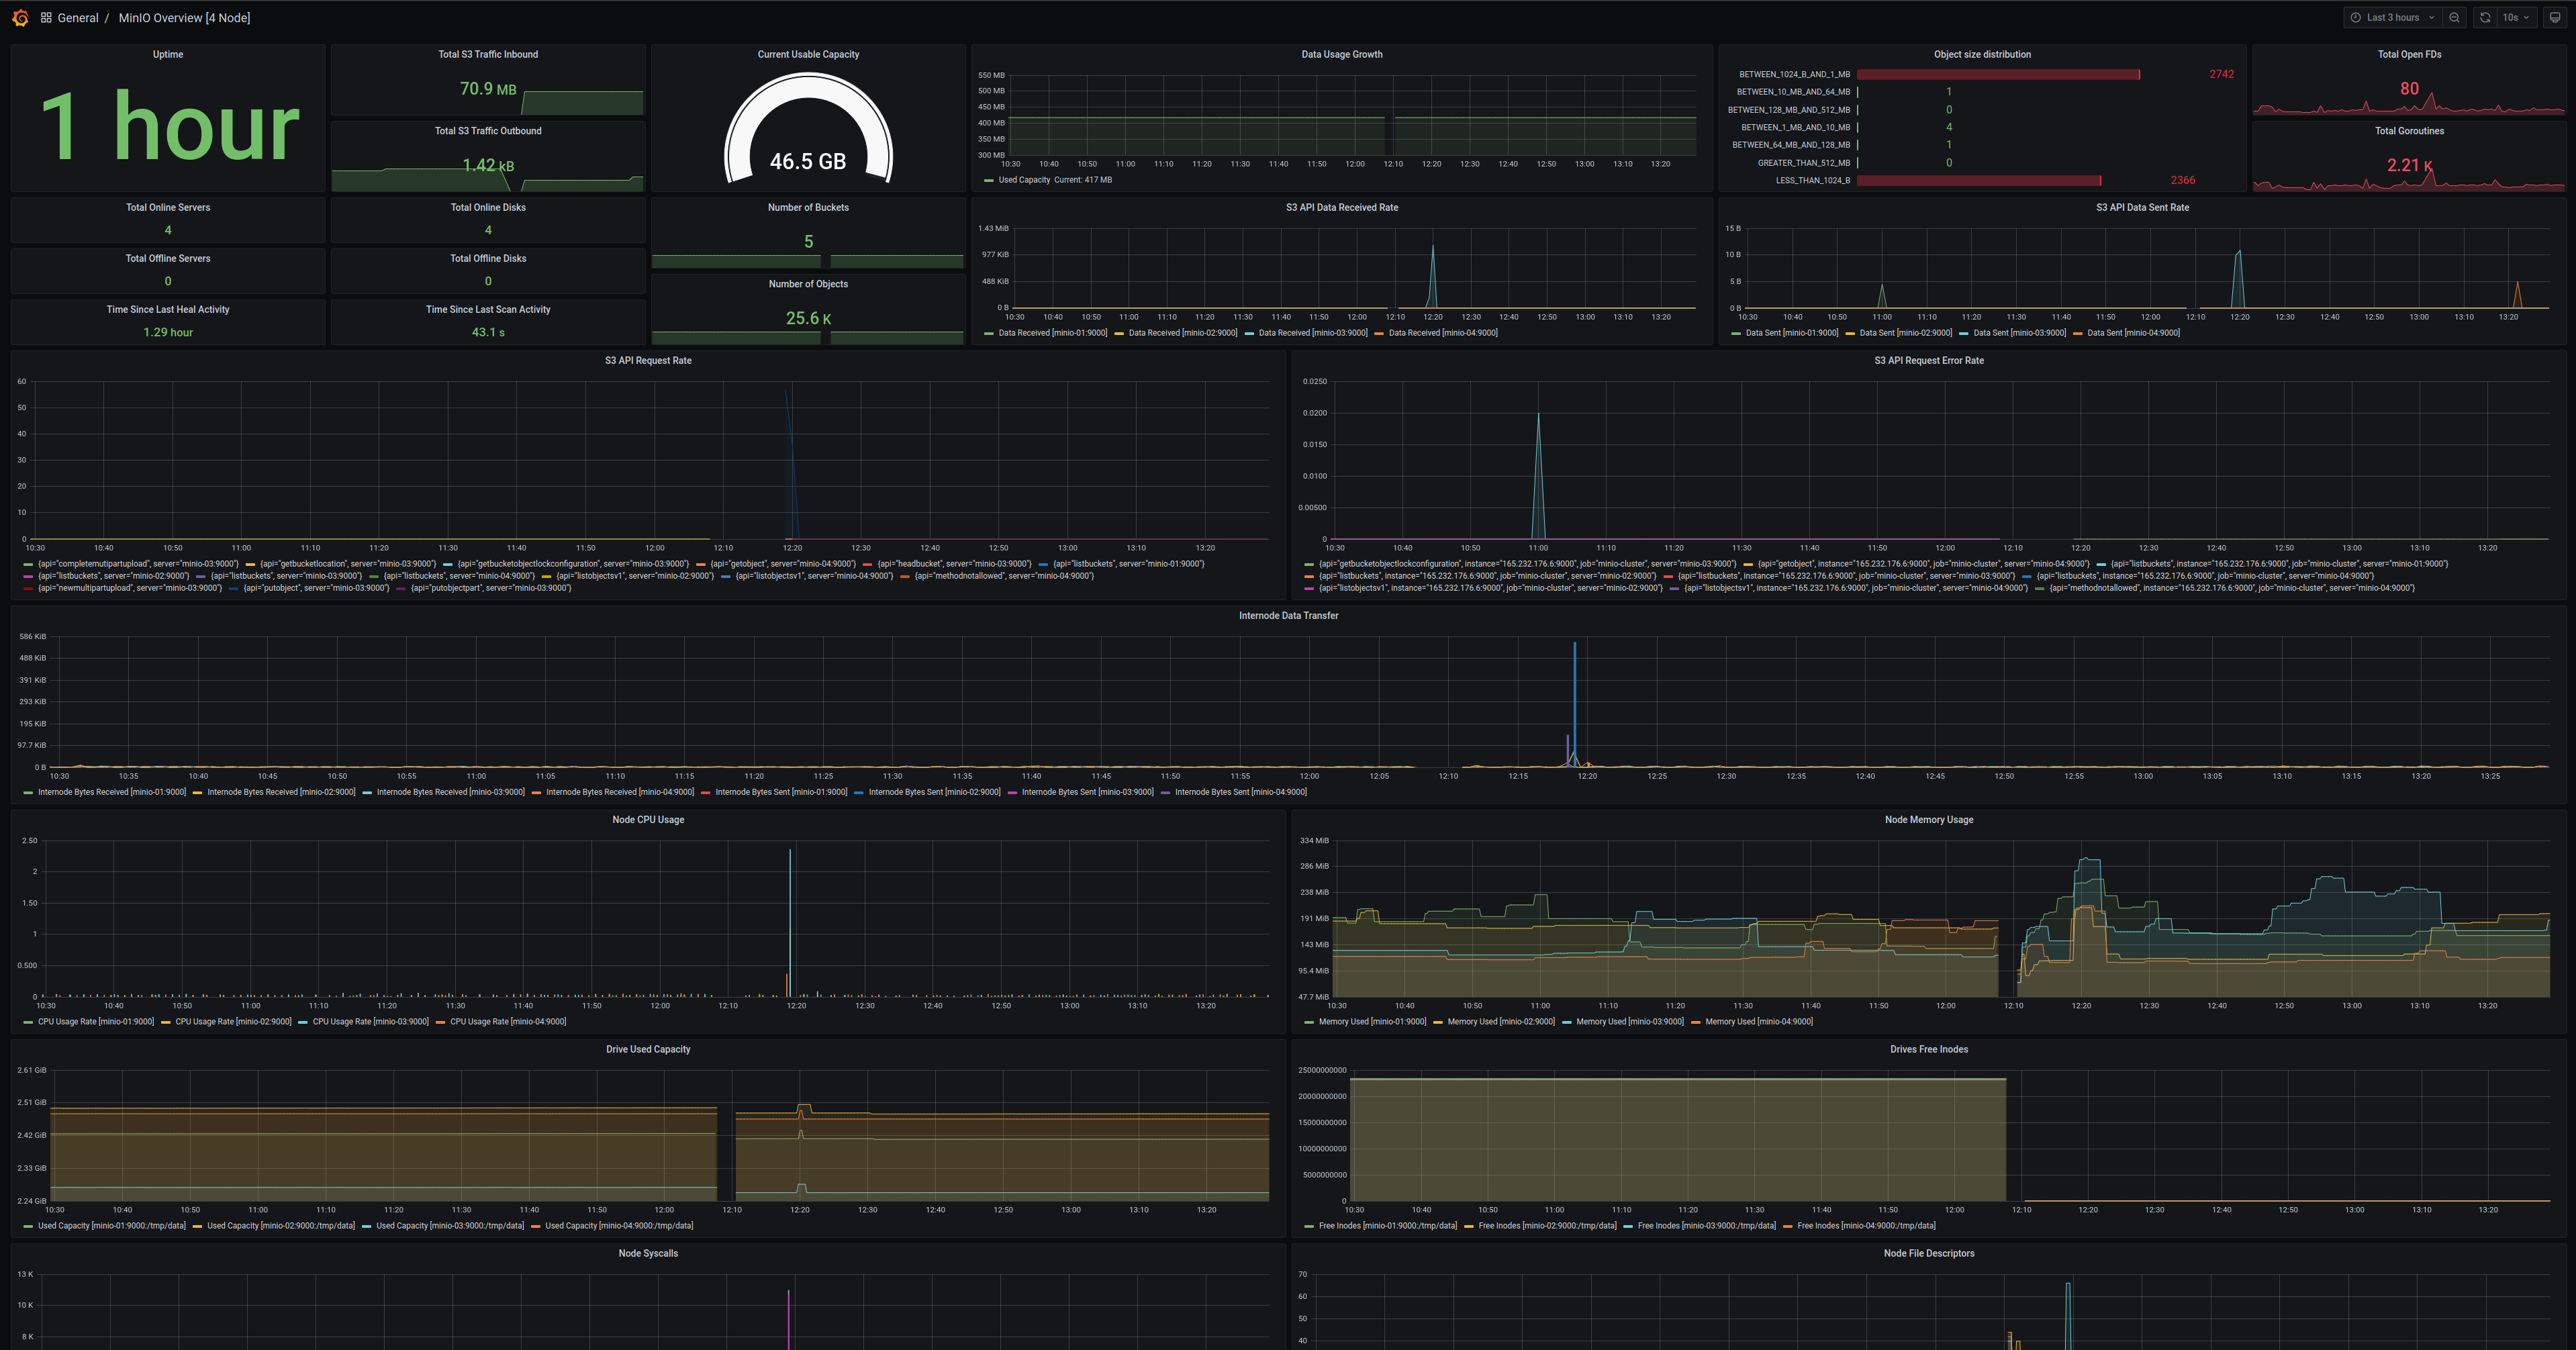
MinIO Server Metrics Dashboard
Browse the maintained MinIO dashboards in the MinIO organization catalog on Grafana, then select a server dashboard compatible with the metrics version exposed by your deployment.
MinIO provides a Grafana Dashboard for MinIO Server metrics. For specifics on the dashboard’s configuration, see the JSON file on GitHub.
For MinIO Deployments running with Server-Side Encryption (SSE-KMS or SSE-S3), the dashboard includes metrics for the KMS. These metrics include status, request error rates, and request success rates.
MinIO Bucket Metrics Dashboard
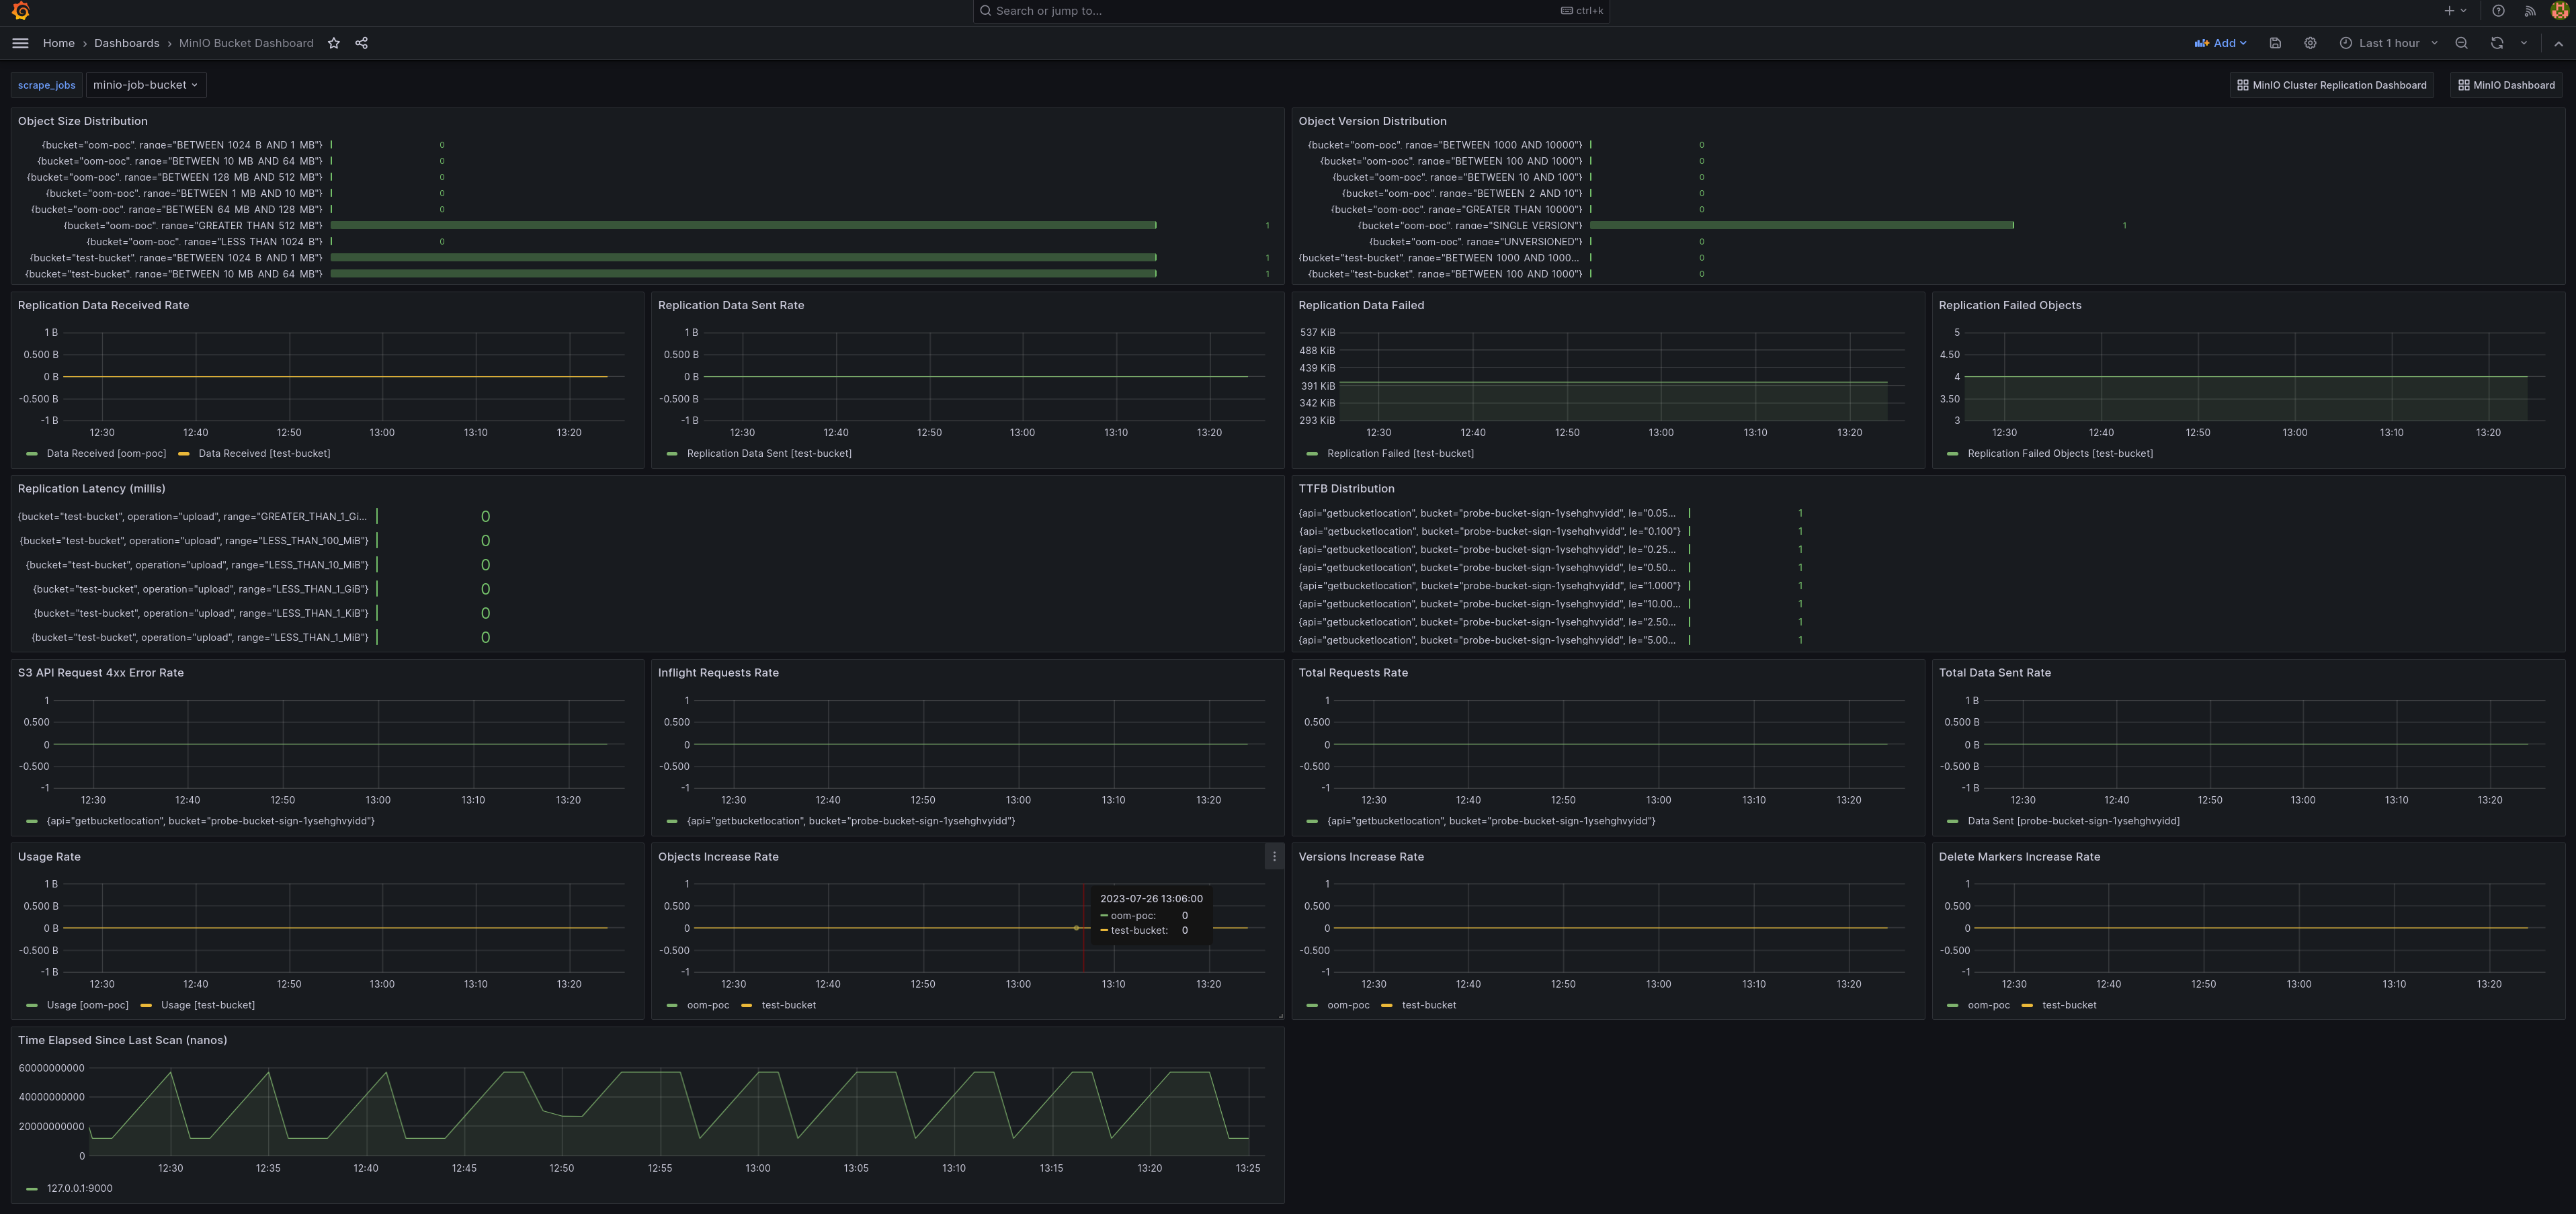
Use the MinIO organization catalog on Grafana to select a bucket dashboard compatible with the metrics version exposed by your deployment.
Bucket metrics can be viewed in the Grafana dashboard using the bucket JSON file on GitHub.
MinIO Node Metrics Dashboard
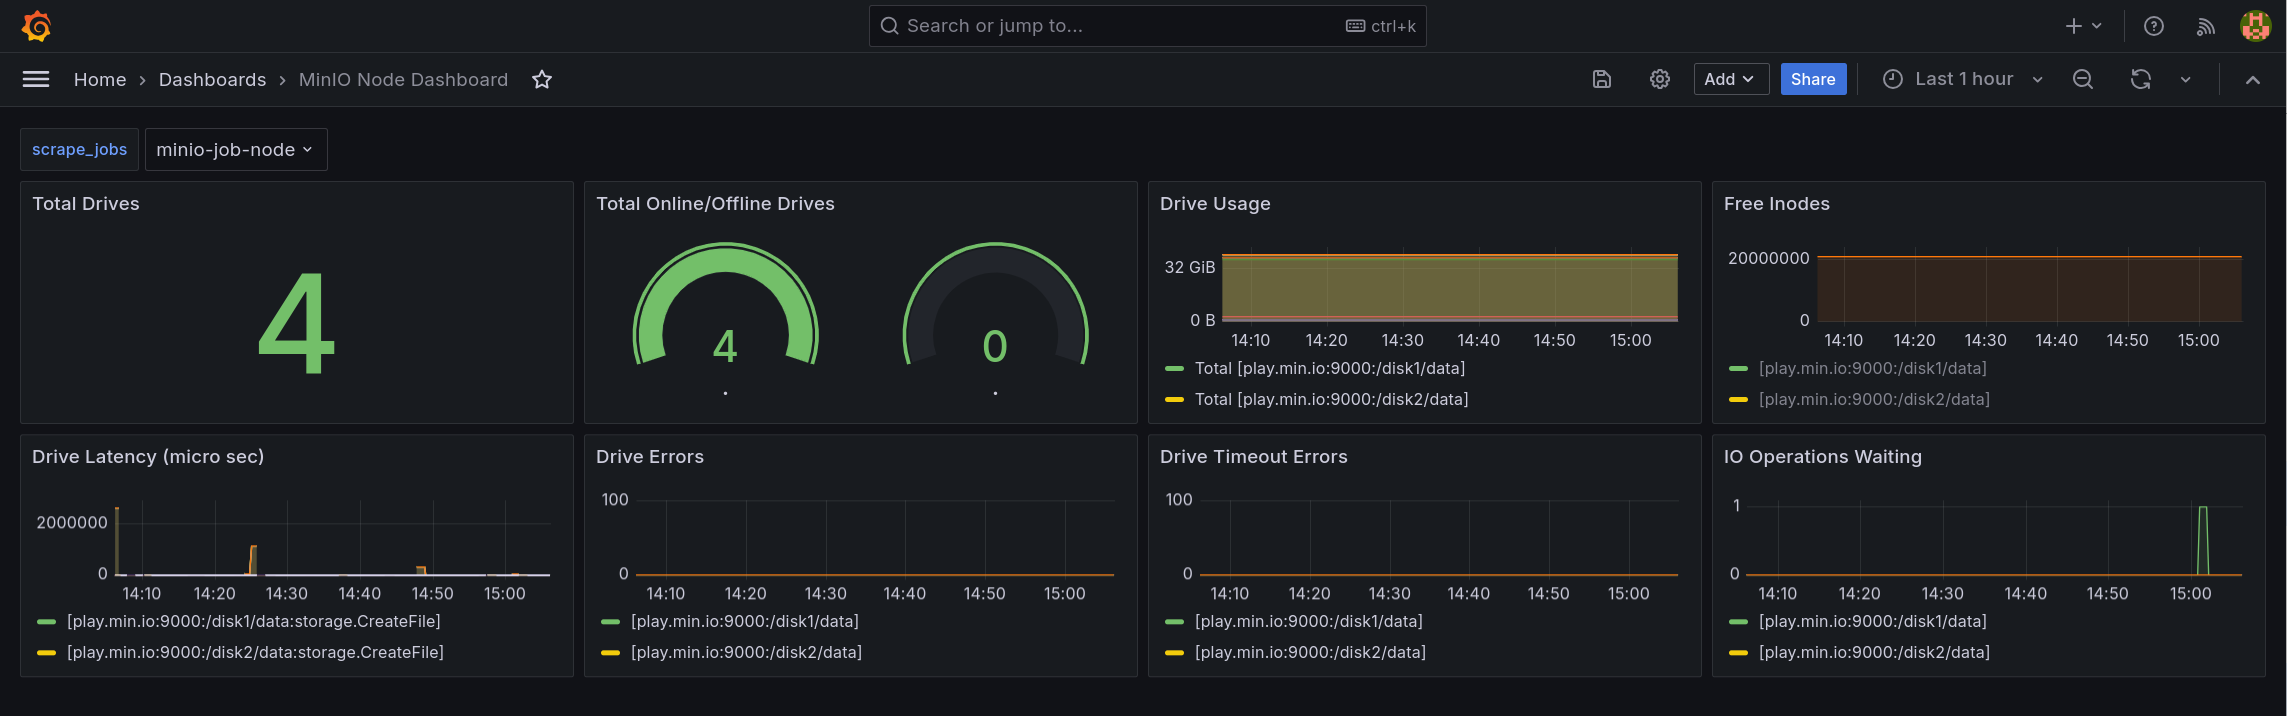
Node metrics can be viewed in the Grafana dashboard using the node JSON file on GitHub.
MinIO Replication Metrics Dashboard
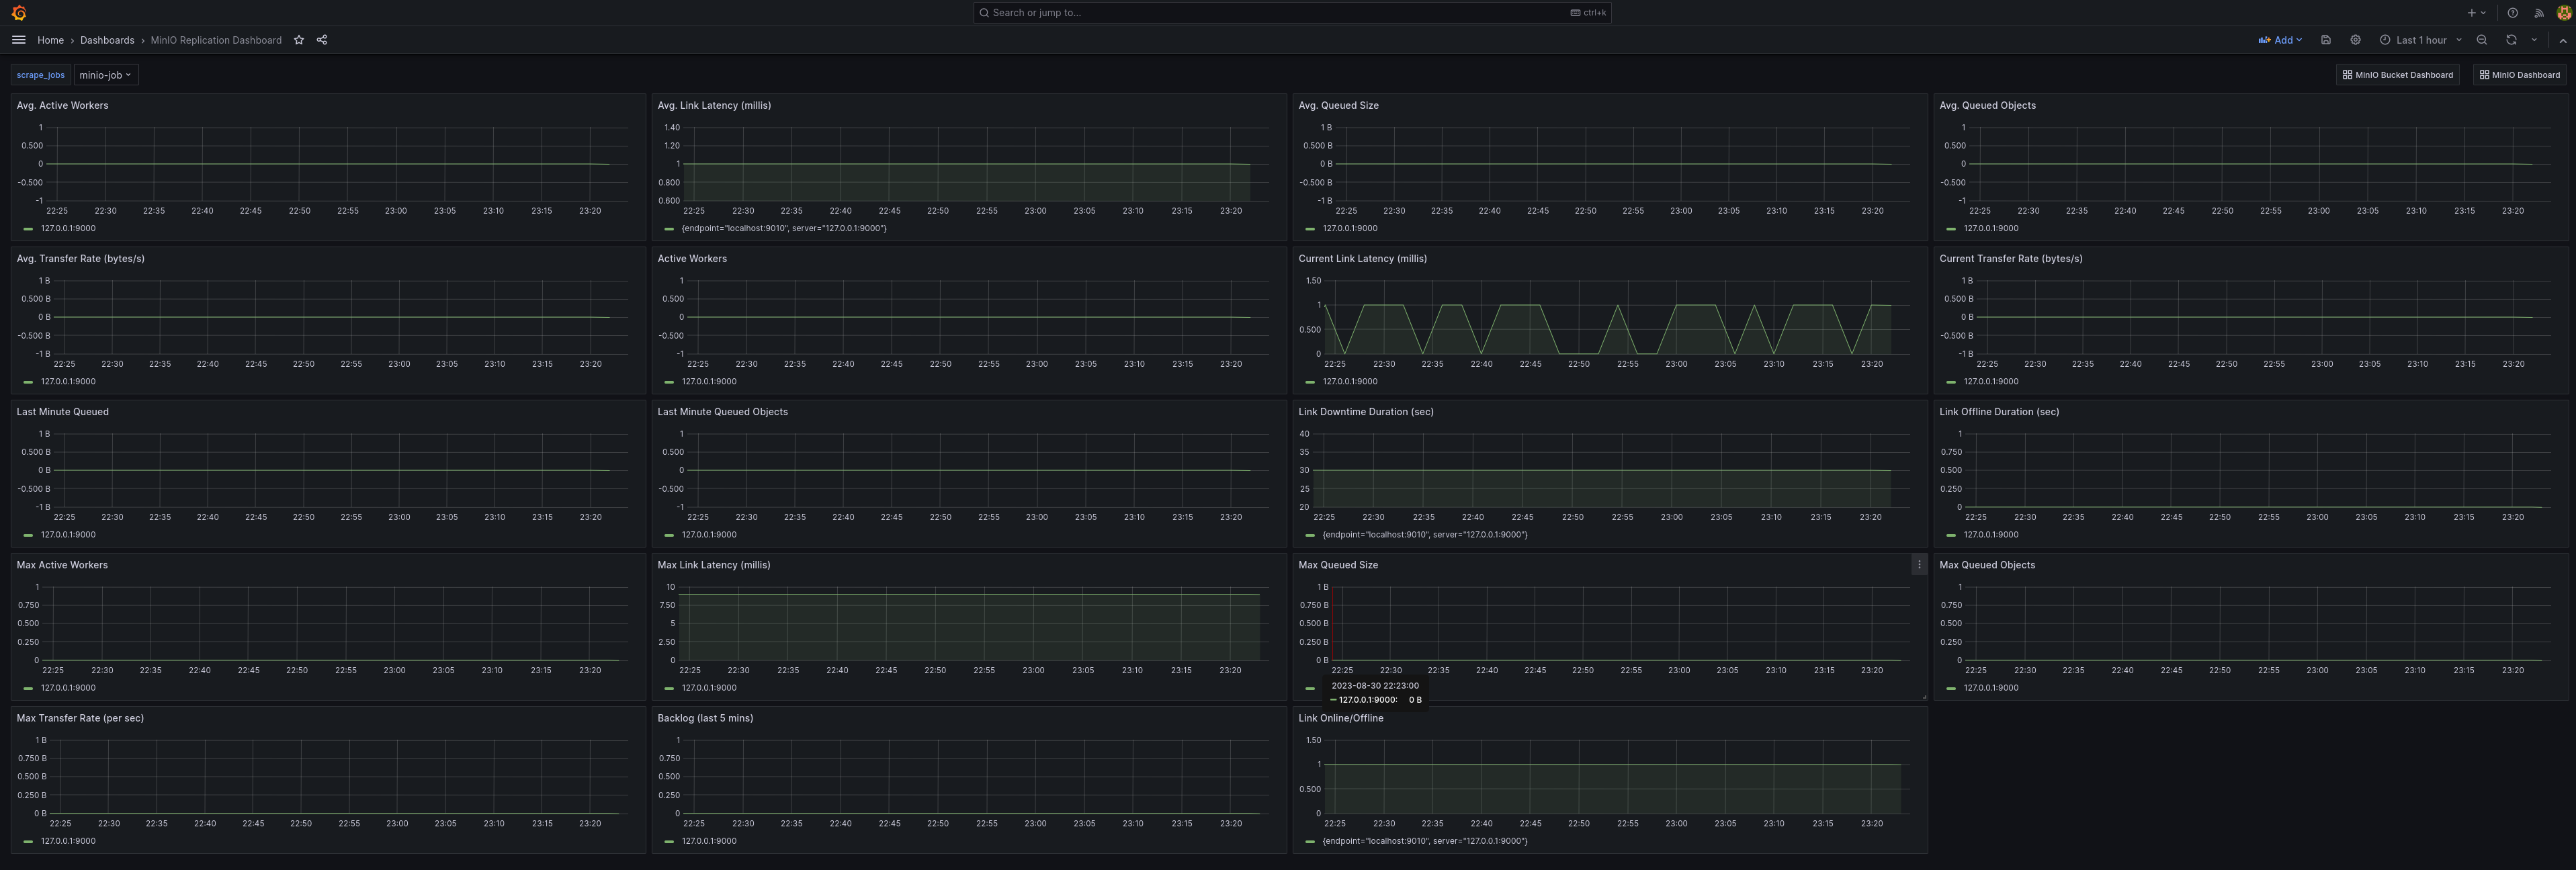
Use the MinIO organization catalog on Grafana to select a replication dashboard compatible with the metrics version exposed by your deployment.
Cluster replication metrics can be viewed in the Grafana dashboard using the cluster replication JSON file on GitHub.